People ignore design that ignores people.
Our dashboards enable engineering teams to take quick decisions. So, a good design is critical.
We have been busy fine-tuning our dashboards to make them more user-friendly. Welcome to SigNal 11 - our monthly product updates where we update you on what we’ve been up to.

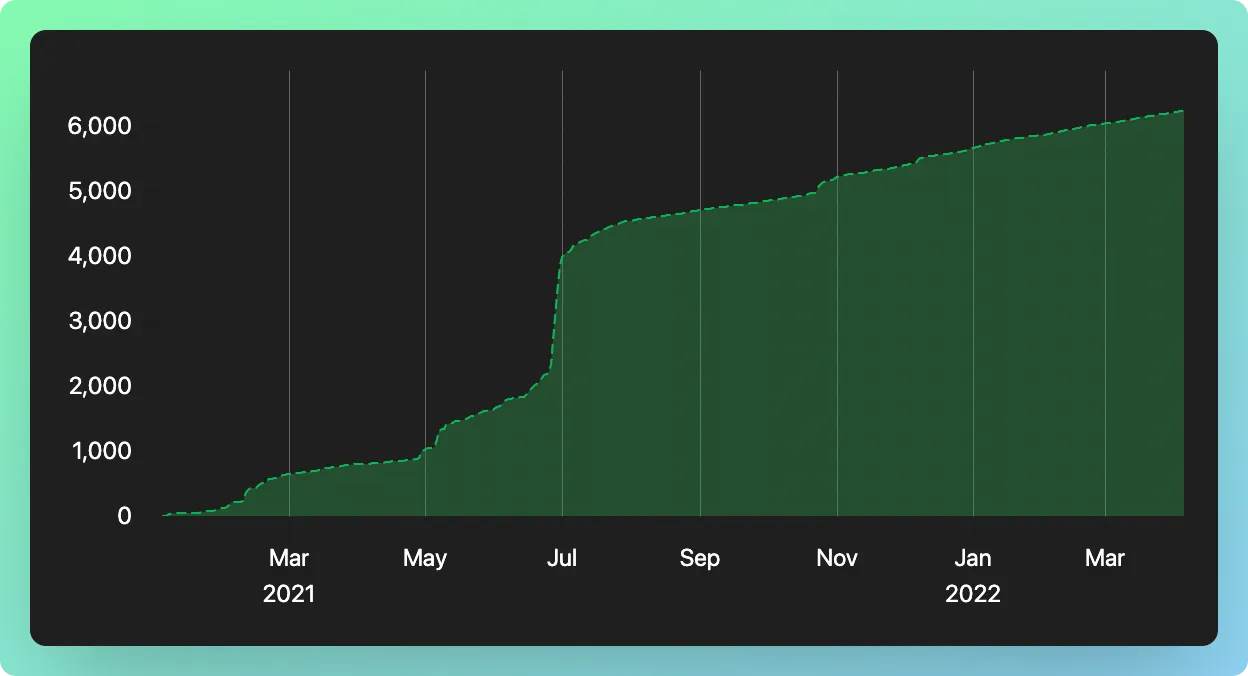
Last month, we crossed 6,000+ GitHub stars, 700+ slack community members, jazzed up our graphs, and much more. Let’s see what humans at SigNoz have been up to in the month of March 2022.
What we shipped?
Releases done last month:
New Y-axis units for all our charts
Earlier, our Y-axis units were not adaptive making it a bit difficult for users to make quick takeaways from the charts. The Y-axis units are now adaptive making it much more readable for our users. For example, in the chart below, you can see all the time duration in ms for the 50th percentile latency.
// import OnClickImage from "@site/src/components/onClickImage";

We have also updated our tooltip to reflect the same units.

Webhooks added in our alert section
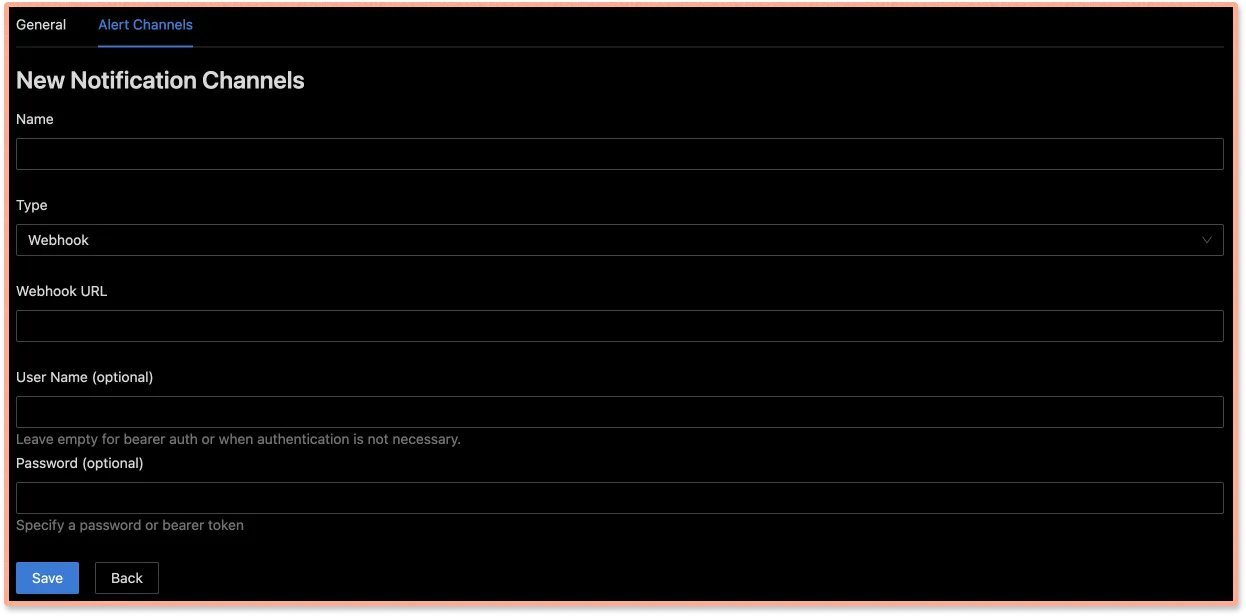
Alerts are an important feature of our product. It enables engineering teams to be on top of any potential performance issues. We have added webhooks to expand our alerts functionality.
Now you can integrate SigNoz alerts with popular technologies like PagerDuty seamlessly.

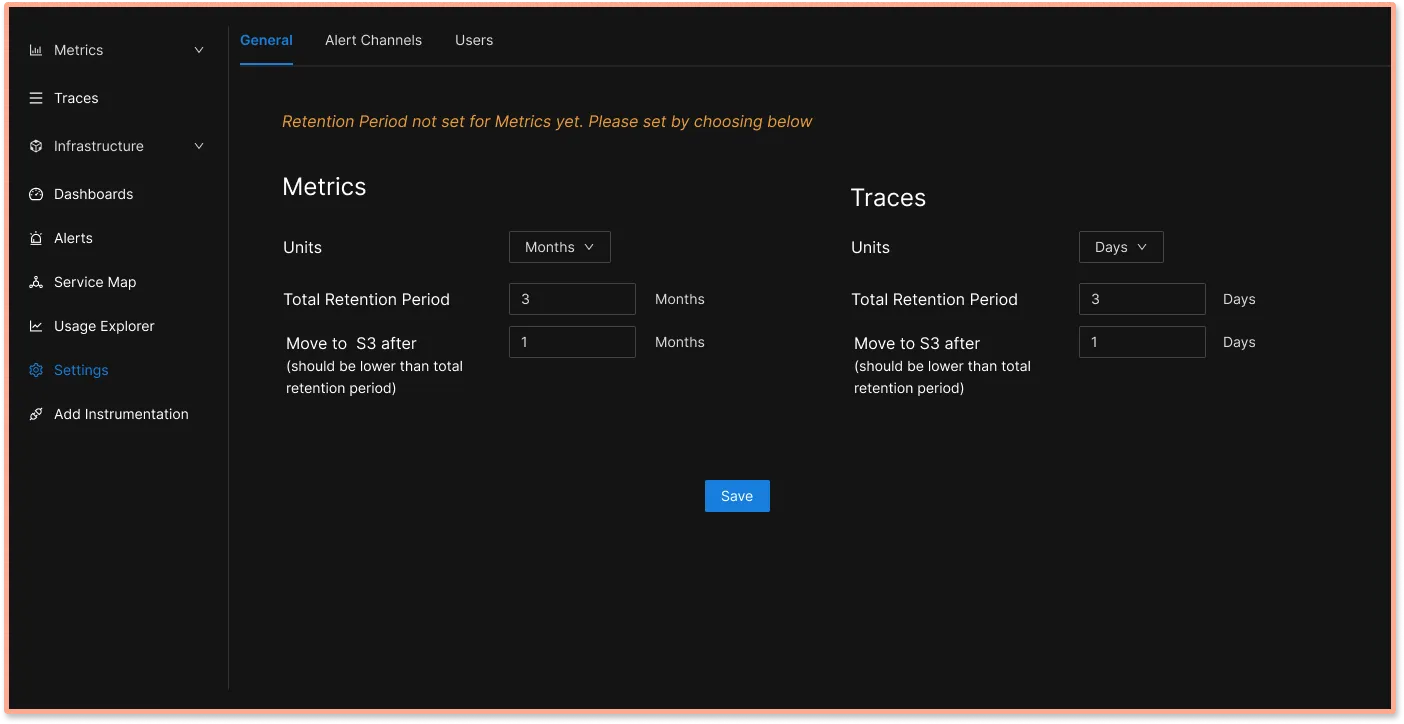
Enabled S3 for long term data retention
Relevant PR:
feat(query-service): Add cold storage support in getTTL API
We have enabled S3 for long term data retention. Now you can set your S3 bucket in SigNoz, and not worry about running out of disk space.

Featured Issue
Deploying SigNoz in large-scale production environments
What are the common issues that you have come across while setting up monitoring for an application with hundreds of microservices? Do let us know if you have an experience doing this, and we will use those insights to make deploying SigNoz a smoother experience.
Feel free to comment on this GitHub issue.
What’s upcoming?
Login, Auth, and Org management
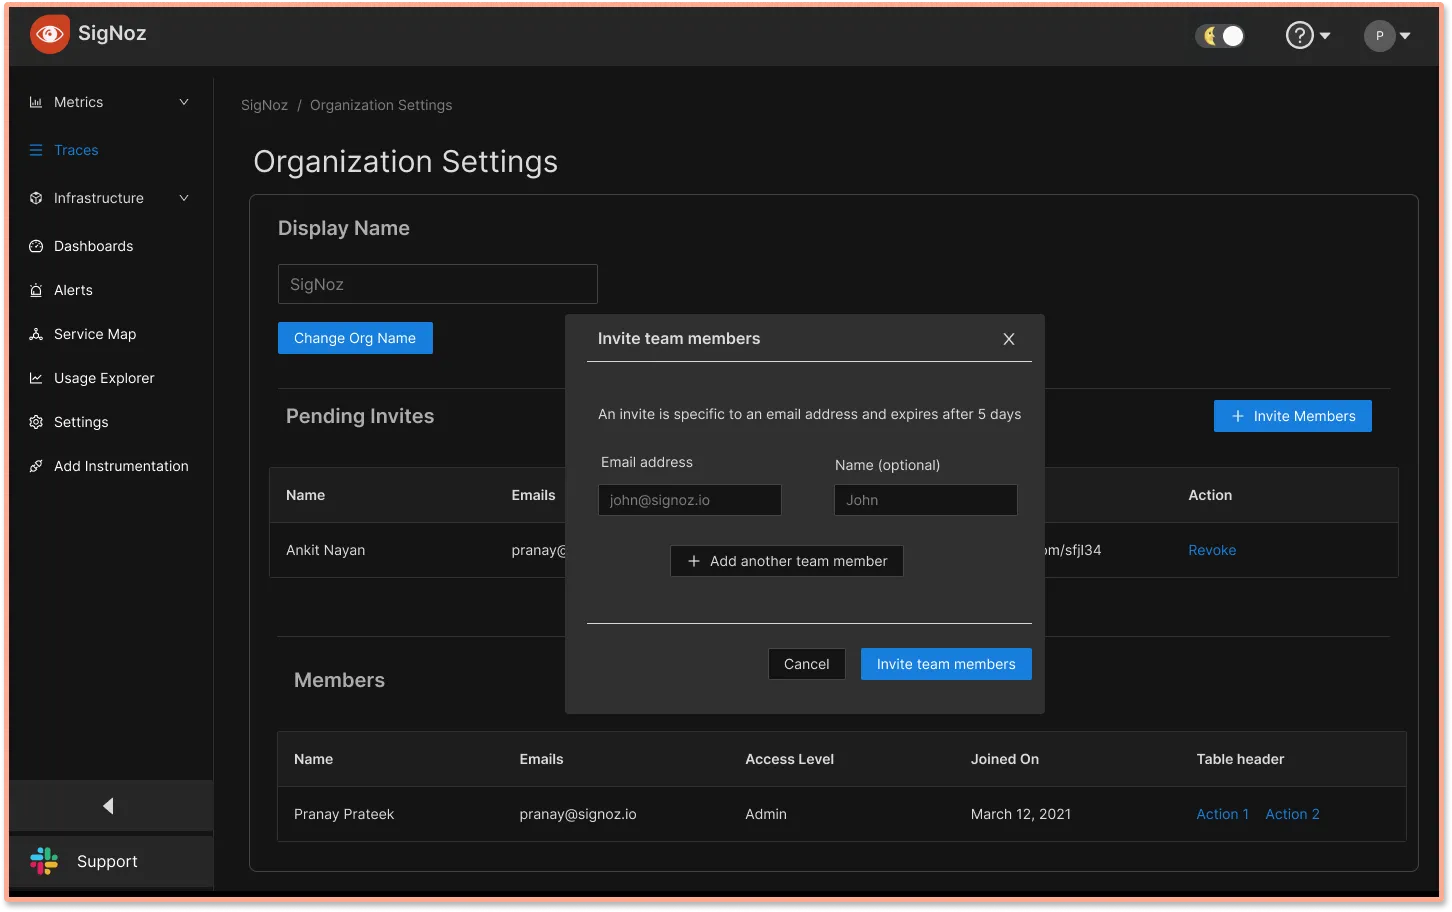
Our team is currently in midst of shipping code for user login, authentication, and org management. It will enable orgs to collaborate better while using SigNoz as a team.
A sneak peek into the design of our org management 👇

Trace Dashboards Performance Improvement
Relevant GitHub issue:
feat: query spans_table to fetch trace details
Our team is working on optimizing the performance of our trace dashboards. As an observability tool, our dashboards will handle a huge scale of data. We use ClickHouse as our database, a very fast OLAP datastore, and we want our query service that runs on top of ClickHouse optimized for greater scale.
Filters on the Metrics page
We will be enabling some filters on our metrics page as requested by our users. SigNoz can monitor a huge number of services, and filters that can enable to list out services based on environment types, namespaces, etc. will come in handy.
SigNoz News
6,000+ Github stars on GitHub ⭐️
Recently, we crossed 6,000+ GitHub stars on our GitHub repo. For an open-source project, a good number of stargazers motivates the project maintainers and is also an indication of the love shown by the community for what we’re building.
We’re thankful to each one of our stargazers for supporting us in our open-source journey!

Check out our GitHub repo to see recent updates 👇
700+ community members
We also crossed 700+ members in our slack community. Join us in our journey of building the next-gen observability tool👇
Contributor Spotlight👩🏻💻
We want to thank our two new contributors who made significant contributions in the latest releases of SigNoz. 🤗
From our blog
Modern digital organizations have rapidly adopted microservices-based architecture for their applications. Microservices-based apps have components designed around business capabilities serving a specific purpose.
But componentization also leads to complexity. Today’s modern internet-scale businesses have hundreds or thousands of microservices. It’s impossible for a single team or a person to have an idea about how user requests get processed in their entirety.
Read on to find out how distributed tracing can help achieve observability for your microservices-based application👇
Achieving Observability for Microservices-based apps using Distributed Tracing
Thank you for taking out the time to read this issue :) If you have any feedback or want any changes with the format, please create an issue.


