Find Your Perfect Datadog Alternative
Answer a few questions to get personalized recommendations in 30 seconds
The rising costs and complexities of monitoring cloud infrastructure are pushing many organizations to explore alternatives to Datadog. With monthly bills sometimes reaching thousands of dollars and feature sets that can be overwhelming, teams are looking for practical, cost-effective solutions that better fit their needs. Whether you're managing a fast-growing startup or overseeing DevOps in a large enterprise, it's crucial to understand your options to make informed decisions about your monitoring stack.
Why Organizations Look for Datadog Alternatives
In one of the earning calls of Datadog, it was revealed that they charged a cryptocurrency company a bill of $65 million USD. A Hacker News thread discussing the report went viral, and there was an outpouring of user stories around Datadog's unpredictable billing practices.
A lot of users also pointed out how the sales team of Datadog relentlessly pursues engineers for signing up for their services, unlike some Datadog competitors.

Datadog's billing has two key issues:
- Very complex SKU-based pricing, which makes it impossible to predict how much it would cost.
- Custom metrics billing ($0.05 per custom metric) - we found that custom metrics can account for up to 52% of the total billing, which just does not make sense.
Want to understand Datadog costs better? Check out our detailed pricing guide or use our interactive pricing calculator.
The monitoring space is highly competitive, but there are a few products that stand out. In this article we will go through the best DataDog alternatives which you can explore while selecting your vendor for application monitoring.
List of top DataDog alternatives in 2024:
SigNoz
SigNoz is a leading open-source observability platform that provides a comprehensive alternative to Datadog. Built natively for OpenTelemetry, it brings together logs, metrics, and traces under a single pane of glass, with proven scalability handling 10TB+ daily data ingestion at enterprises like NetApp, Samsung, Comcast, and Salesforce.
One of the real challenges of using open source tools to set up an observability stack is to stitch together multiple tools like Jaeger for tracing and Prometheus for metrics. SigNoz is an open source tool that provides a SaaS-like experience.
Key Features
- Full-Stack Observability: Unified platform for logs, metrics, traces and exceptions
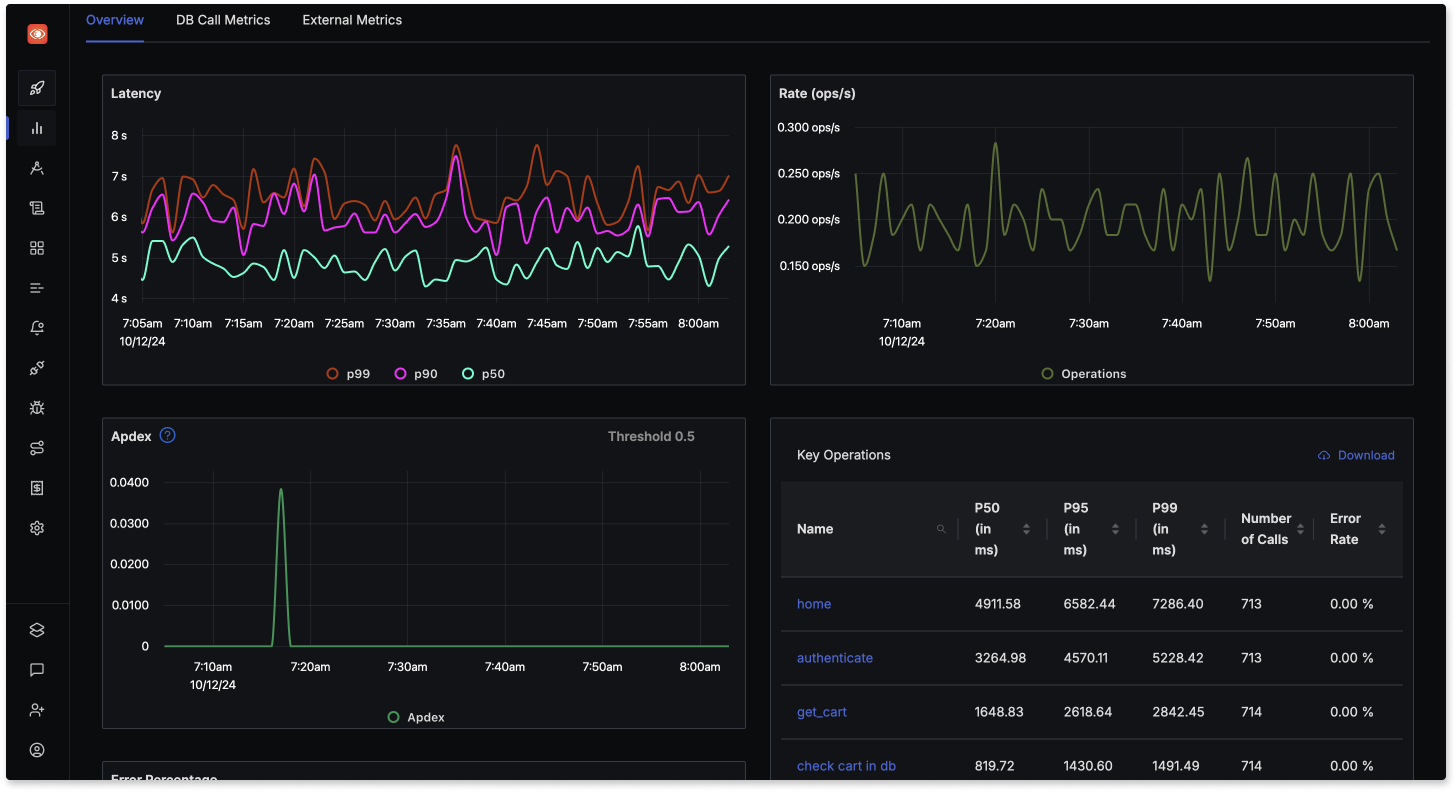
- Application Performance Monitoring: Monitor service metrics, latency, errors and dependencies
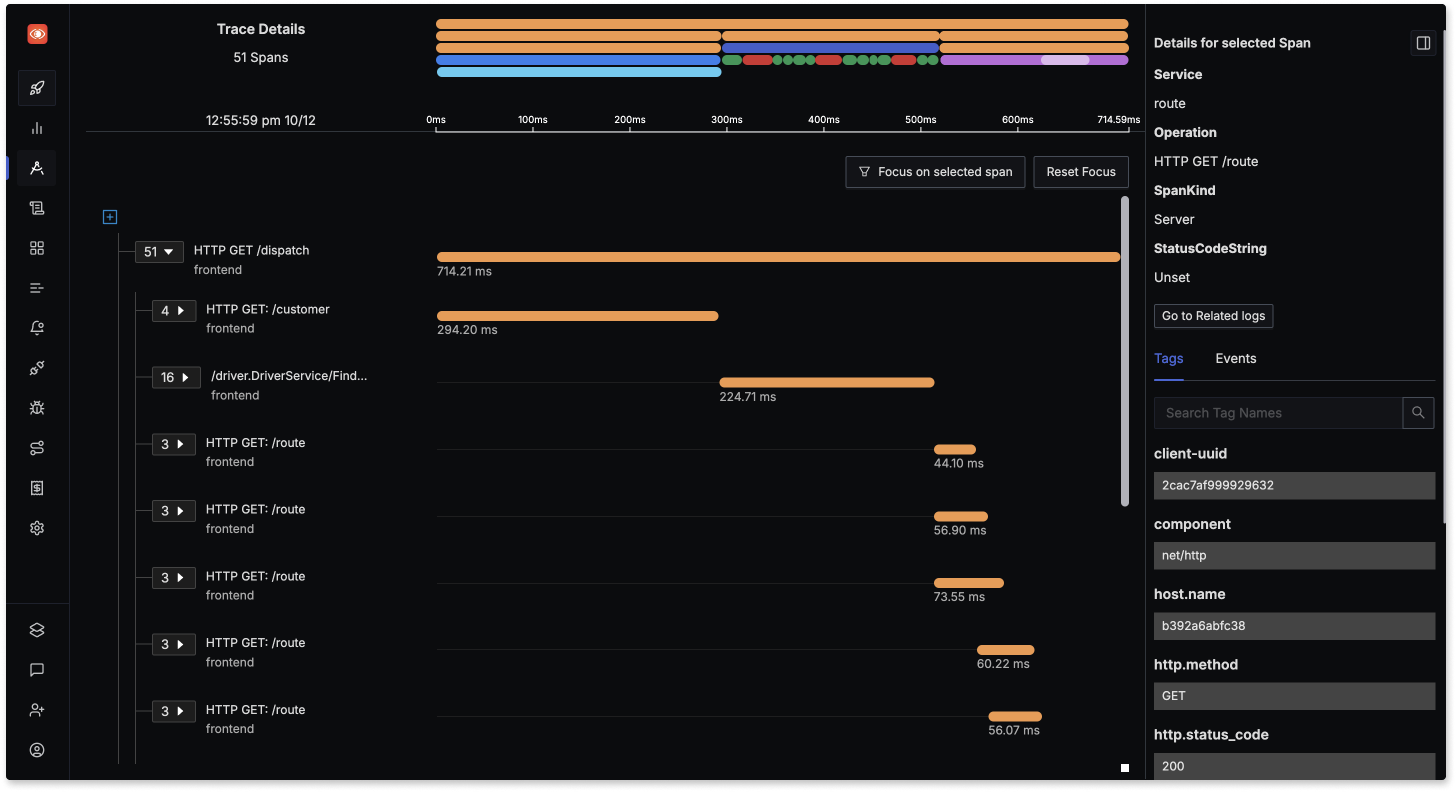
- Distributed Tracing: Track requests across microservices with powerful trace analytics
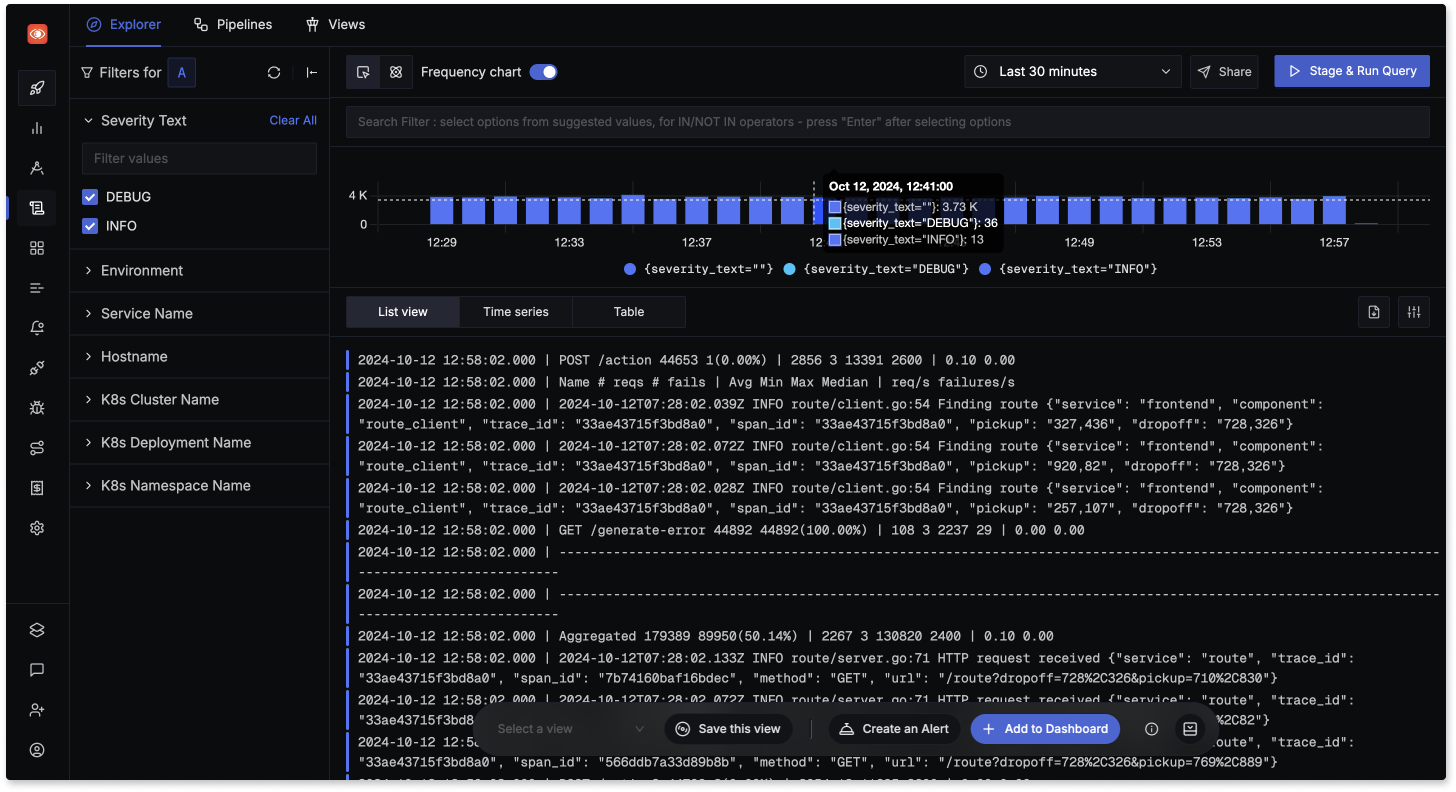
- Log Management: Ingest and analyze logs at scale with advanced querying
- Infrastructure Monitoring: Track infrastructure with customizable dashboards
- Alerts & Notifications: Set up alerts across any telemetry signal

APM
Distributed Tracing
Log Management
Pros
- Native OpenTelemetry support with best-in-class visualizations
- Simple usage-based pricing with no user limits or hidden costs
- Flexible deployment options (self-hosted or cloud)
- Advanced correlation between logs, metrics and traces
- Powerful ClickHouse-based query engine
- Enterprise features like SSO, SAML and advanced security
Cons
- Newer platform compared to established vendors
- Self-hosted deployment requires operational expertise
- Community support primarily through Slack/GitHub
Best For
- Teams looking for an open-source, cost-effective Datadog alternative
- Organizations wanting full control over their observability data
- Companies standardizing on OpenTelemetry
- Teams needing flexible deployment options (cloud/self-hosted)
- Enterprises requiring advanced security and compliance features
For a detailed comparison, check out SigNoz vs Datadog.
Ready to Optimize Your Observability Costs?
Discover how SigNoz offers a seamless migration path from Datadog with comparable features and significant cost savings.
New Relic
New Relic is one of the oldest companies in this domain and can be a solid DataDog alternative. If you opt for a full user plan, you can get access to all the tools New Relic provides in its observability stack.
Key Features
- Application Performance Monitoring: End-to-end visibility into application performance
- Browser & Mobile Monitoring: Track frontend and mobile app performance
- Infrastructure Monitoring: Monitor hosts, containers and cloud services
- Log Management: Centralized log aggregation and analysis
- Synthetic Monitoring: Proactive monitoring of user journeys
- Serverless Monitoring: Monitor AWS Lambda and other serverless platforms
- AIOps & Analytics: AI-powered insights and anomaly detection
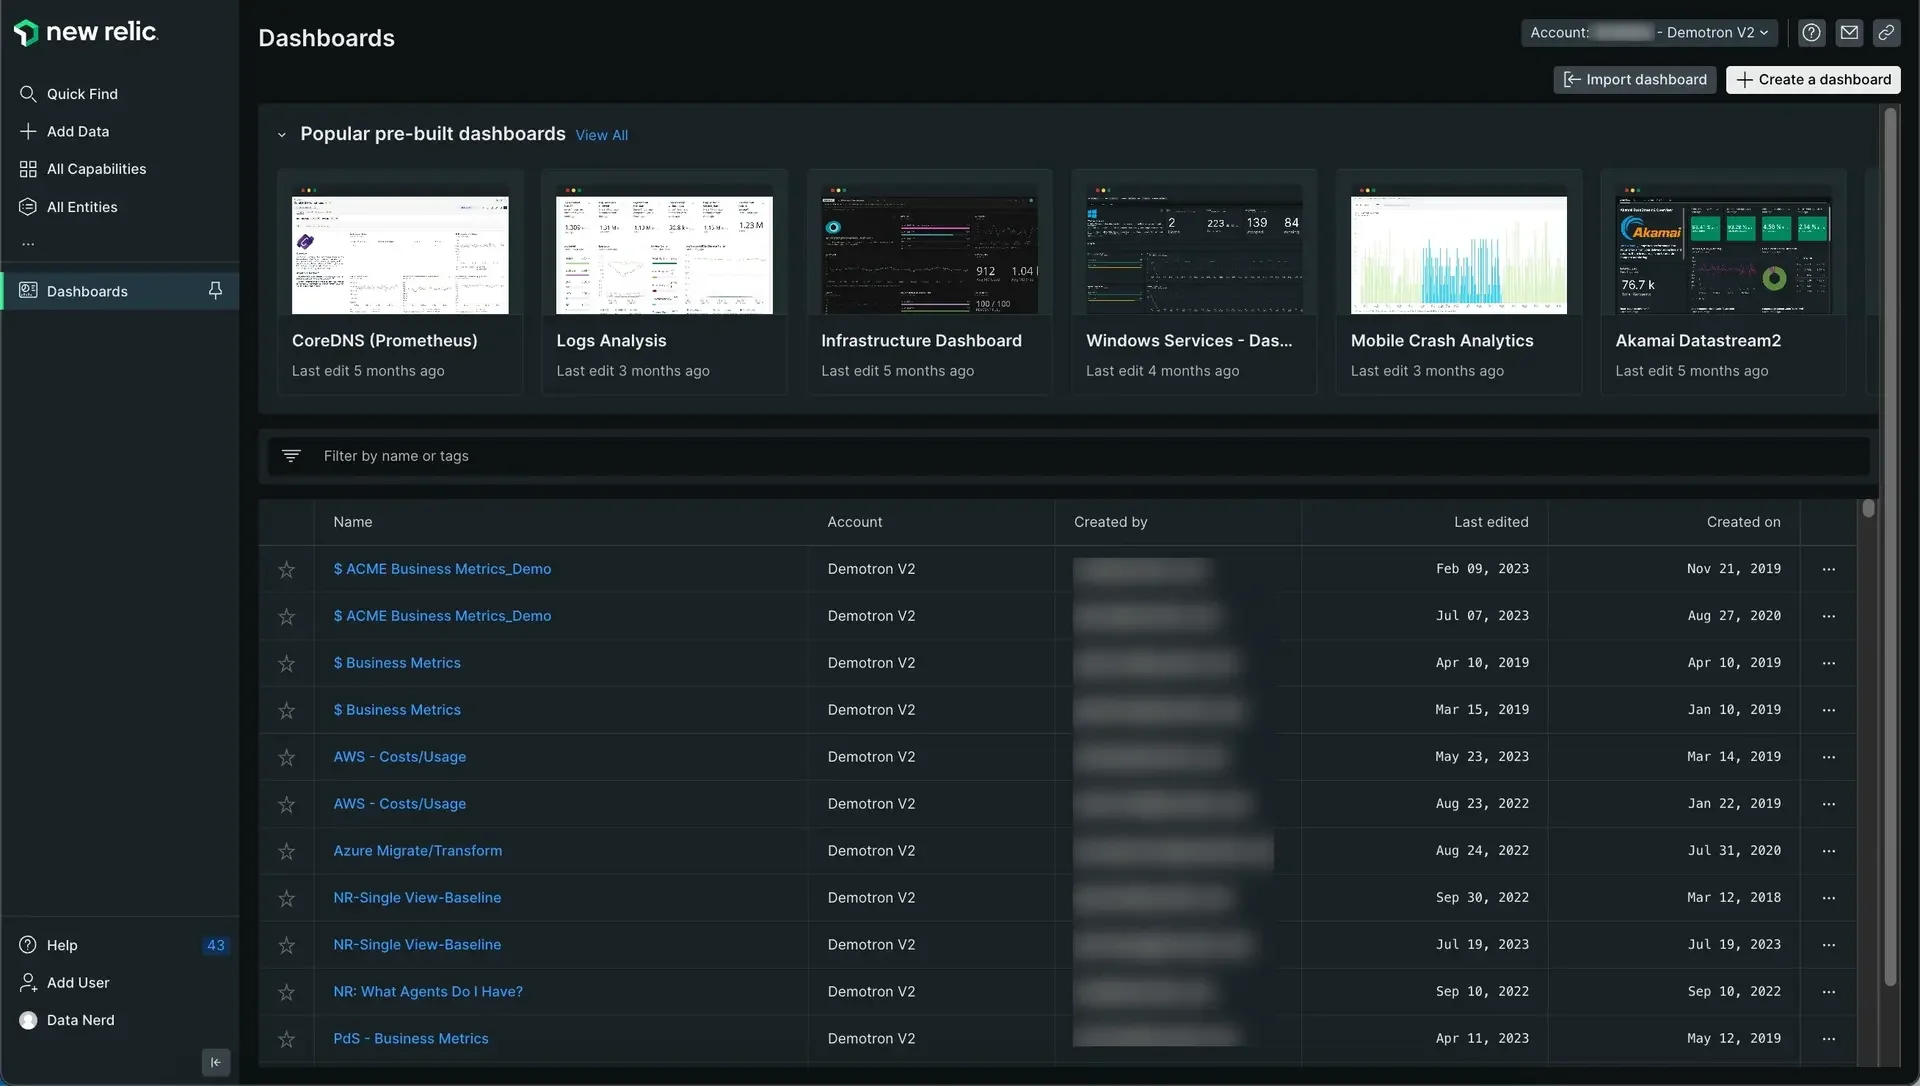
Standard offering includes plans for teams up to 5 full users. Their pricing depends on the amount of data ingested with 100 GB free data ingest and $0.30 per extra GB. One issue with New Relic pricing is its user-based pricing. Apart from data ingestion, New Relic also charges based on the number of users using the product. New Relic's user pricing can go up to $549/user. At scale, the cost of adding users can go up to 66% of the total bill.
Pros
- Comprehensive full-stack observability platform
- Strong APM capabilities with detailed transaction tracing
- Generous free tier with 100GB data ingestion
- AI-powered analytics and troubleshooting
- Extensive integrations ecosystem
- Proven enterprise-grade platform
Cons
- Complex user-based pricing model
- High per-user costs (up to $549/user)
- User costs can reach 66% of total bill at scale
- Learning curve for new users
- Limited customization options
Best For
- Enterprise organizations needing comprehensive observability
- Teams wanting proven, mature monitoring solutions
- Organizations with dedicated observability budgets
- Companies needing strong APM capabilities
- Teams requiring extensive integration options
For a detailed comparison, read more on DataDog vs New Relic.
Dynatrace
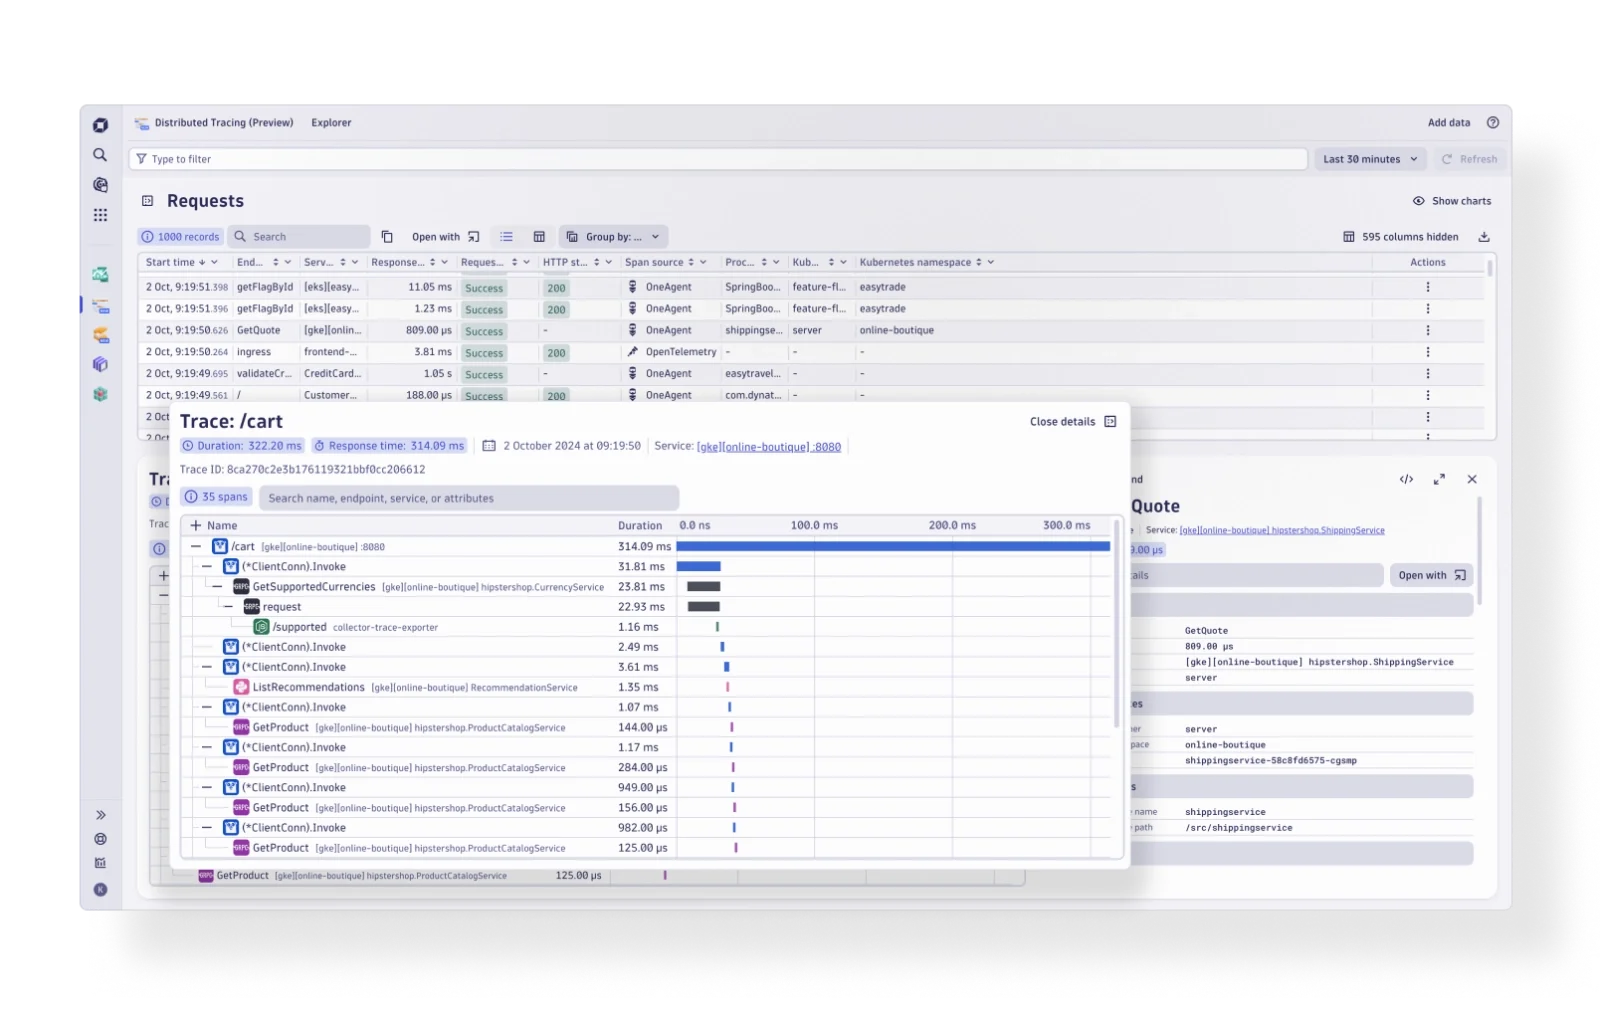
Dynatrace is another strong contender among Datadog competitors, providing a broad spectrum of monitoring services aimed at large-scale enterprises. To use Dynatrace, you need to install a single agent per host which will collect all relevant metrics. Dynatrace calls this agent OneAgent and it can serve the following use-cases for monitoring:
Key Features
- Application Performance Monitoring: End-to-end visibility with OneAgent technology
- Infrastructure Monitoring: Monitor hosts, cloud services and virtual machines
- Container Monitoring: Support for Docker, Kubernetes environments
- Network Monitoring: Deep network visibility and analysis
- Root Cause Analysis: AI-powered problem detection and analysis
- User Experience Monitoring: Track and analyze user interactions
- Cloud Automation: Automated deployment and configuration
Full-stack monitoring, the Dynatrace product aimed to provide observability for apps, is priced at $69 per month for 8 GB per host if billed annually.
Pros
- Single agent (OneAgent) deployment model
- Strong AI-powered analytics and automation
- Comprehensive infrastructure monitoring
- Enterprise-grade security features
- Detailed root cause analysis
- Extensive cloud platform support
Cons
- Higher price point ($69/month/8GB host)
- Complex pricing structure
- Steep learning curve
- Enterprise focus may not suit smaller teams
- Resource-intensive agent
Best For
- Large enterprise organizations
- Teams needing AI-powered analytics
- Organizations with complex infrastructure
- Companies requiring detailed root cause analysis
- Teams wanting unified agent deployment
For detailed comparison, please read DataDog vs Dynatrace.
Grafana
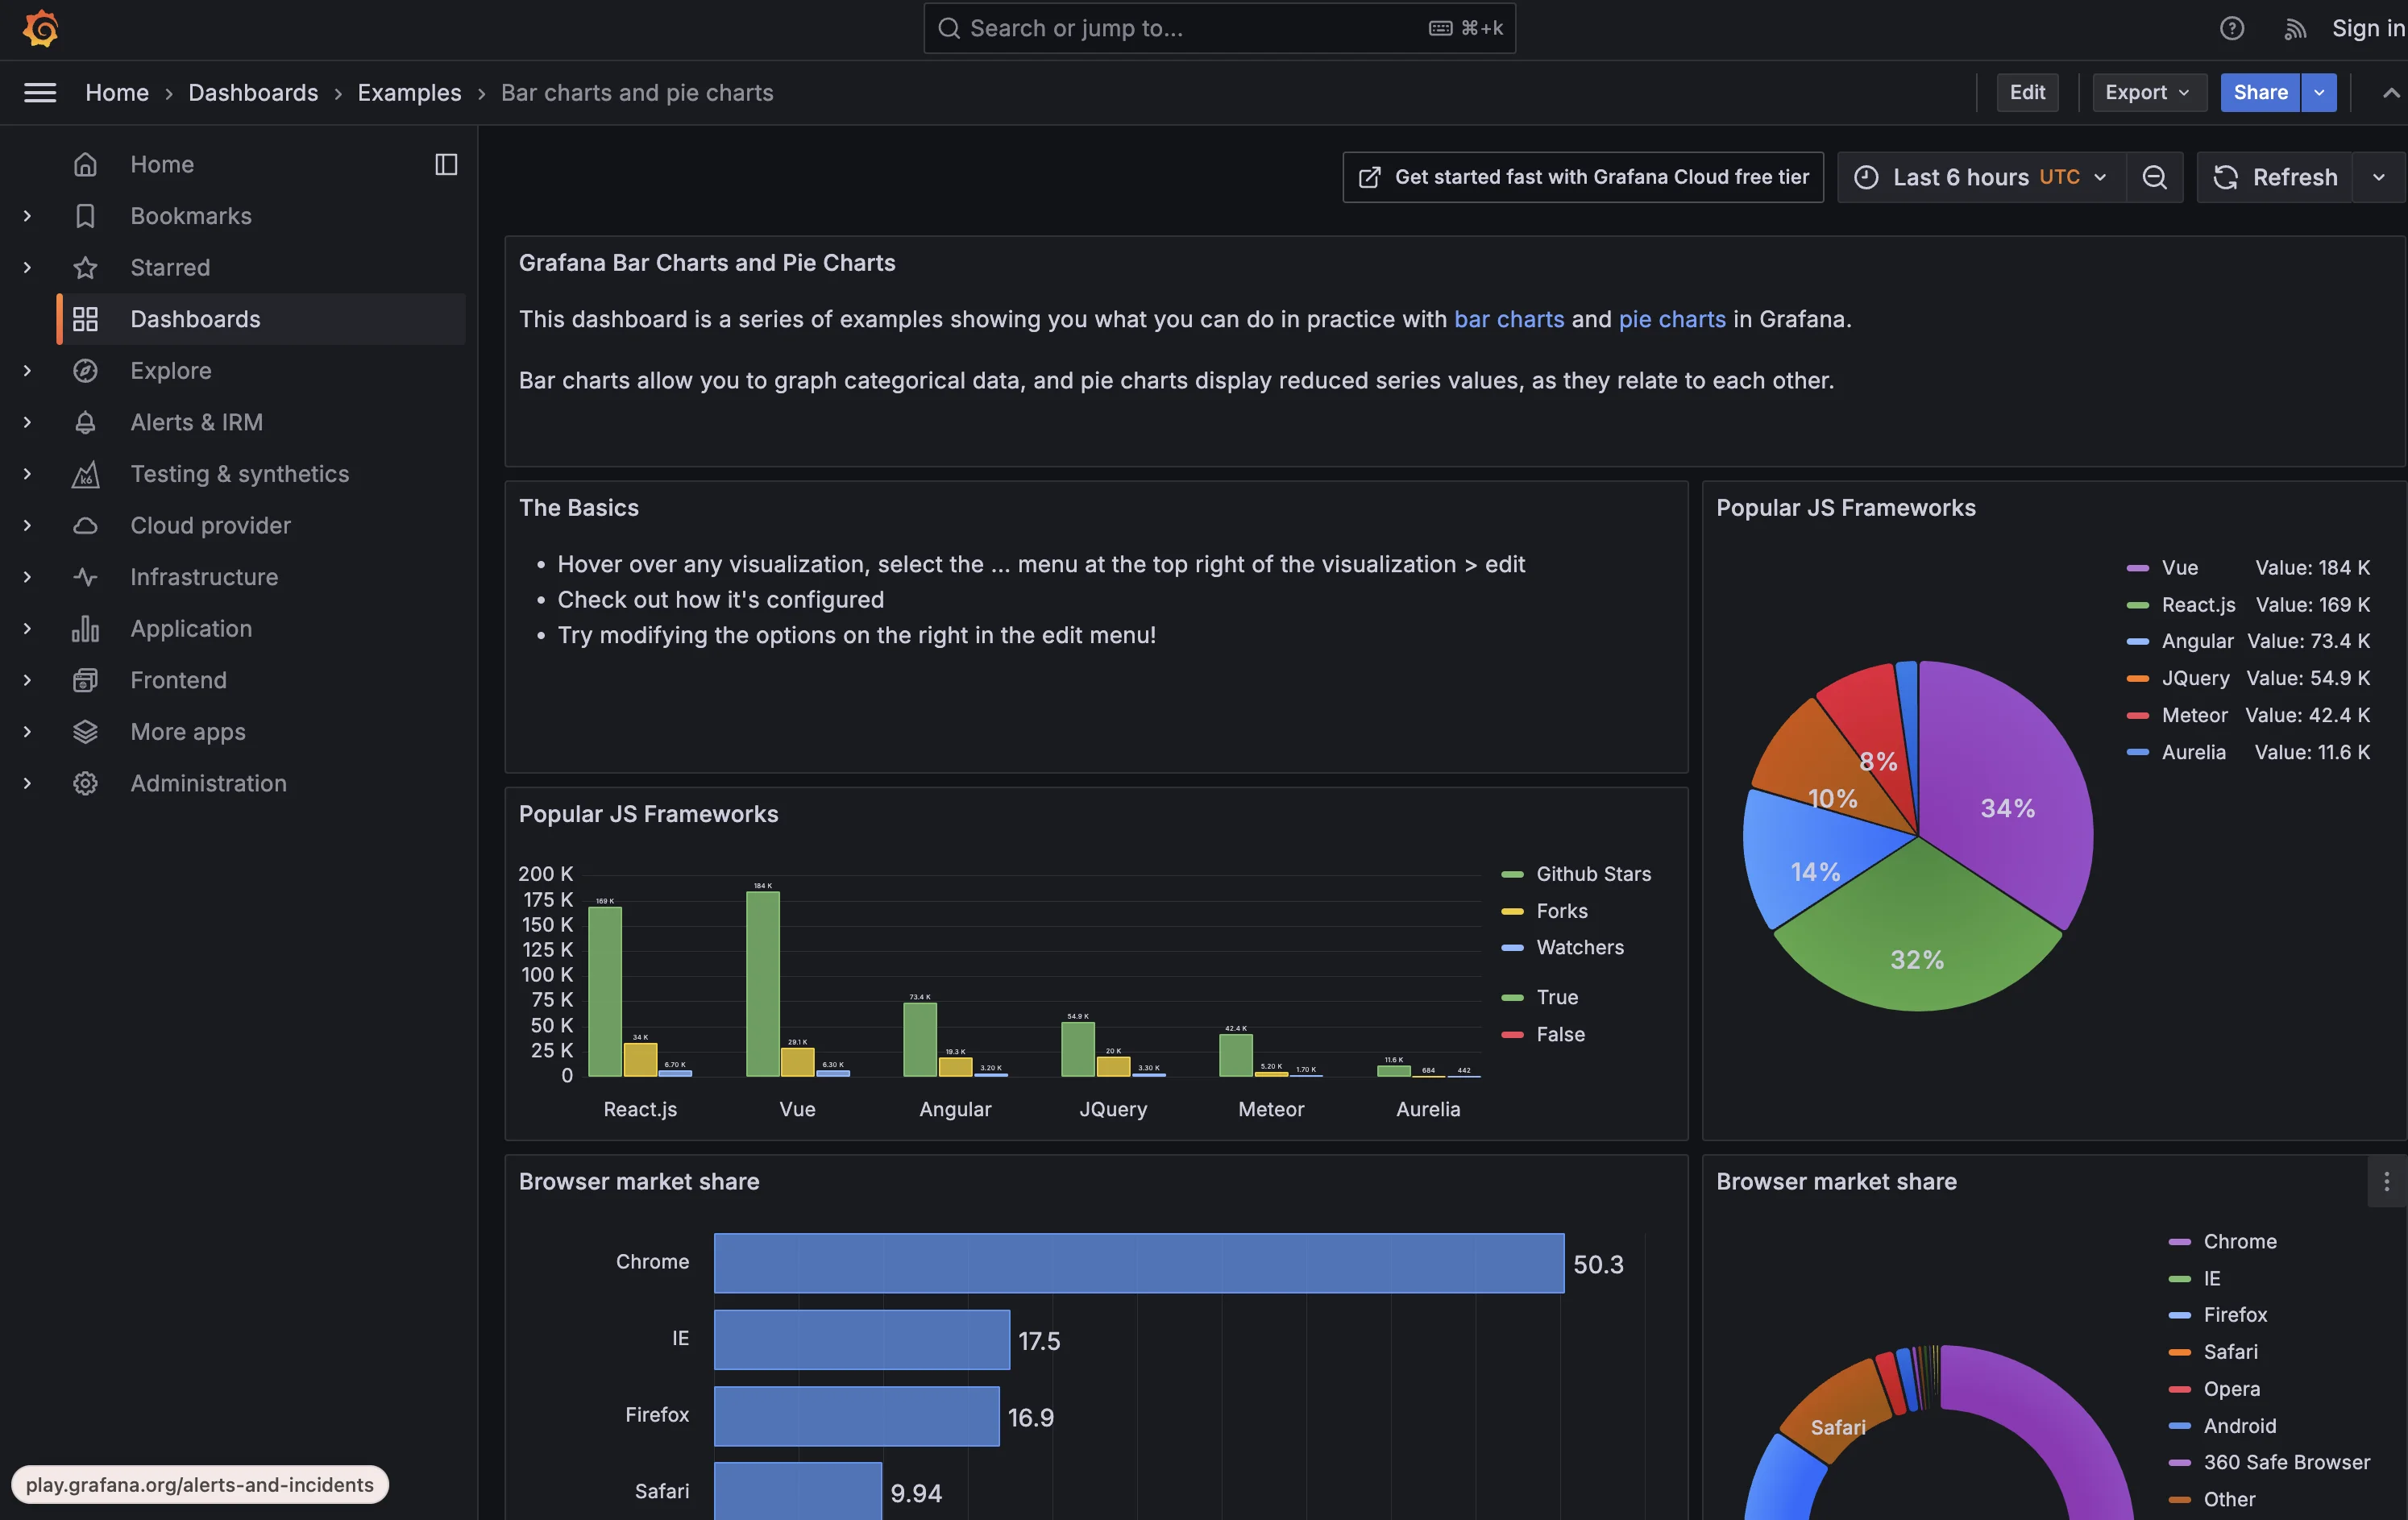
Grafana is an open-source data visualization tool that you can use as a Datadog alternative. It offers a cloud service called Grafana Cloud, where you can send your logs, metrics, and traces for APM and overall observability.
If you're looking to use Grafana as a Datadog alternative, then you'll use the core LGTM stack. It is particularly popular in cloud-native environments, offering a comprehensive solution for observability that covers logs, metrics, traces, and visualization.
The LGTM Stack Components
Grafana's observability platform is built on the LGTM stack:
- Loki: An efficient log aggregation system that indexes log metadata, enabling cost-effective storage and fast querying, integrated seamlessly with Grafana.
- Grafana: A versatile visualization tool offering customizable dashboards to display and analyze data from various sources, including metrics, logs, and traces.
- Tempo: A distributed tracing backend focused on scalability, storing and querying trace data, with easy integration into Grafana for visualization.
- Mimir: A long-term, scalable storage system for Prometheus metrics, ensuring high performance and availability for large-scale metric data.
Key Features
- Visualization & Dashboarding: Create customizable dashboards to analyze and display data from multiple sources
- LGTM Stack Integration: Core observability components working together seamlessly
- Cloud-Native Support: Designed for modern containerized and microservices architectures
- Open Source Foundation: Built on open-source technologies with strong community support
- Multi-Backend Support: Connect to various data sources and backends
Pros
- Open-source foundation with enterprise features
- Highly customizable dashboards
- Support for multiple data sources
- Strong community and ecosystem
- Cost-effective compared to proprietary solutions
Cons
- Managing multiple backend components can be complex
- Steeper learning curve for advanced features
- Self-hosted deployment requires operational expertise
- Enterprise features require paid subscription
Read more about Grafana vs Datadog.
LogicMonitor
LogicMonitor is a SaaS-based hybrid observability platform powered by AI that helps organizations monitor and optimize their IT infrastructure and applications.
It can be used as a DataDog alternative if you're looking for infrastructure monitoring. It also provides AIOps features, including root cause analysis, anomaly detection, and forecasting.
Key Features
- Unified Platform: Single platform for infrastructure, cloud, and application monitoring
- AIOps Capabilities: AI-powered anomaly detection, root cause analysis, and forecasting
- Dynamic Topology Mapping: Automated discovery and visualization of infrastructure dependencies
- Extensive Integrations: Over 3000 pre-built integrations and monitoring templates
- Automated Deployment: Quick setup with automatic discovery and configuration
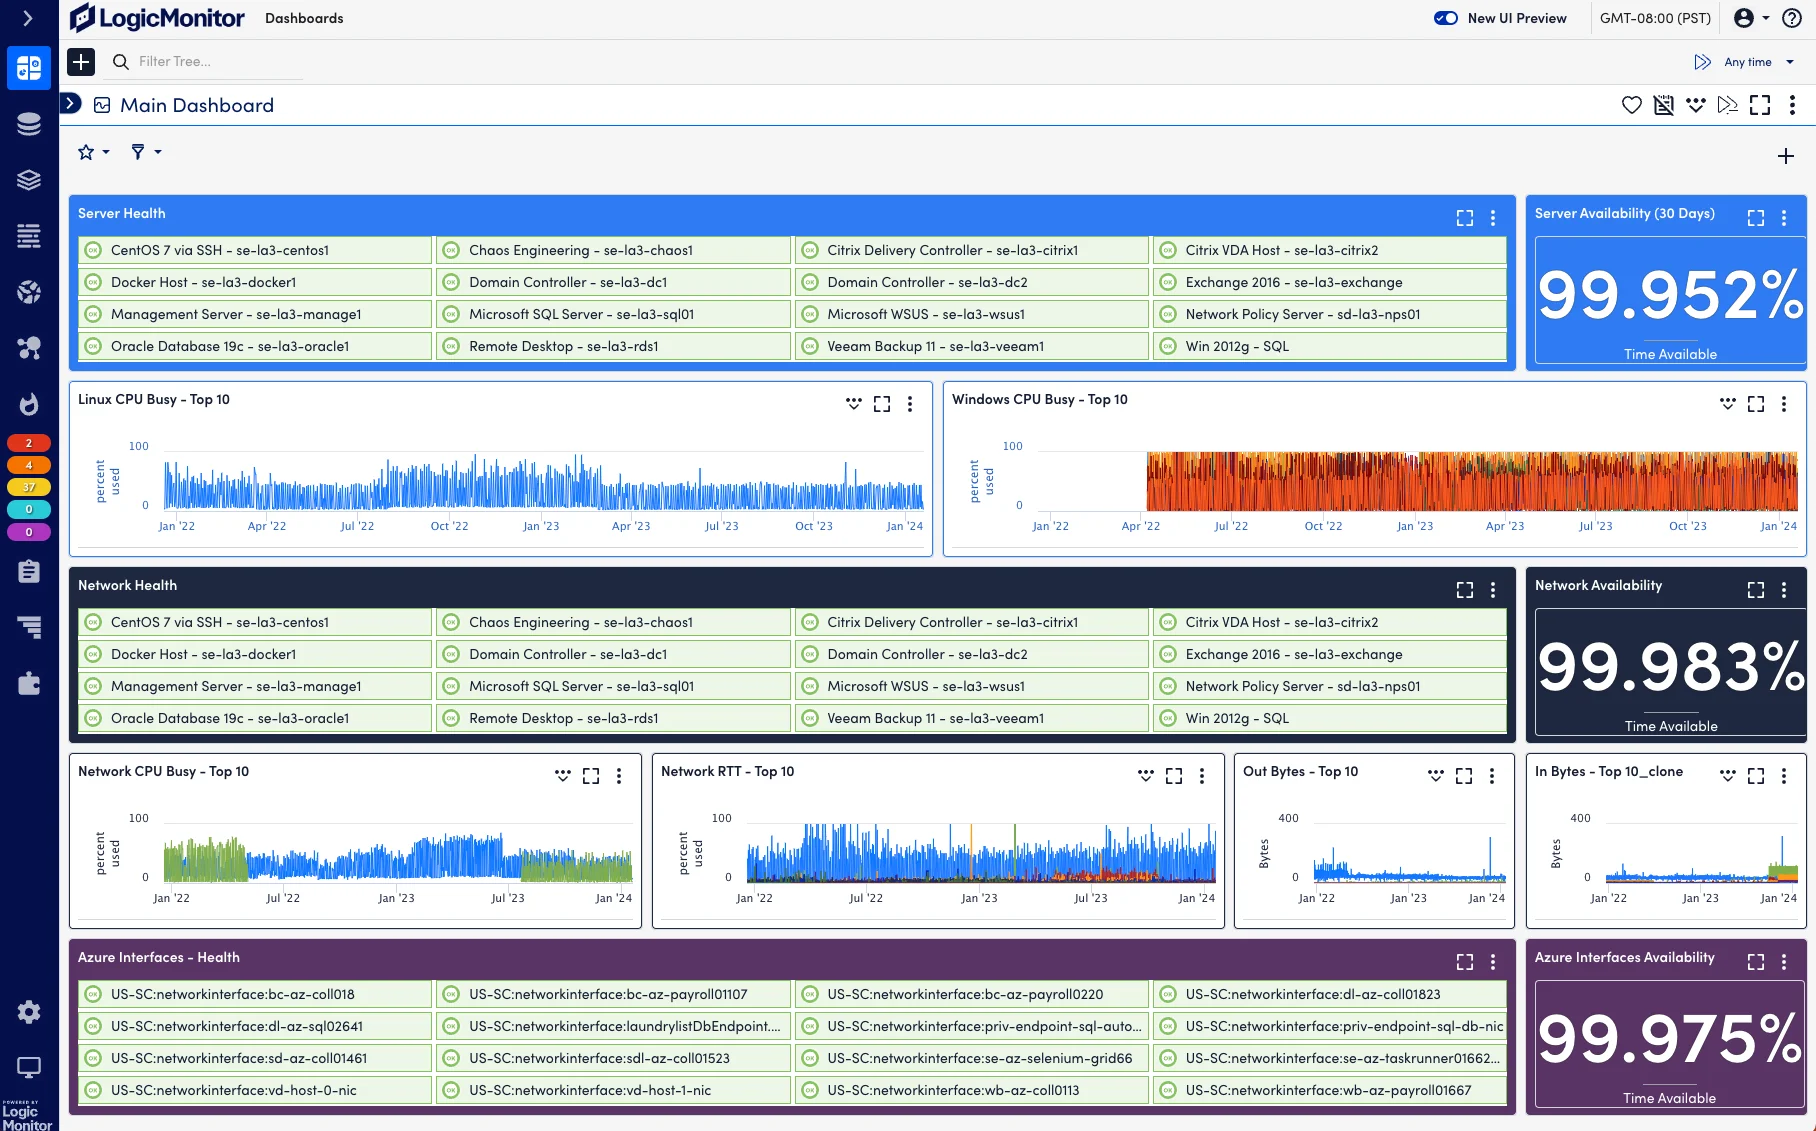
LogicMonitor's dynamic topology mapping is a feature that distinguishes it from other Datadog competitors.
With dynamic topology mapping, you can have an overview of your network devices and their inter-dependency. Some of the key monitoring capabilities provided by LogicMonitor are:
- Infrastructure Monitoring
- Cloud Monitoring (AWS, Azure, GCP)
- Application Performance Monitoring
- Log Analytics
- Distributed Tracing
- Configuration Monitoring
- Service Insights
Pros
- Comprehensive hybrid observability solution
- Reduces alert noise by 90%
- Improves MTTR by 46%
- Easy deployment and automation
- Strong AIOps capabilities
Cons
- Can be complex for small organizations
- Pricing may be higher for extensive deployments
- Some advanced features require additional configuration
AppDynamics
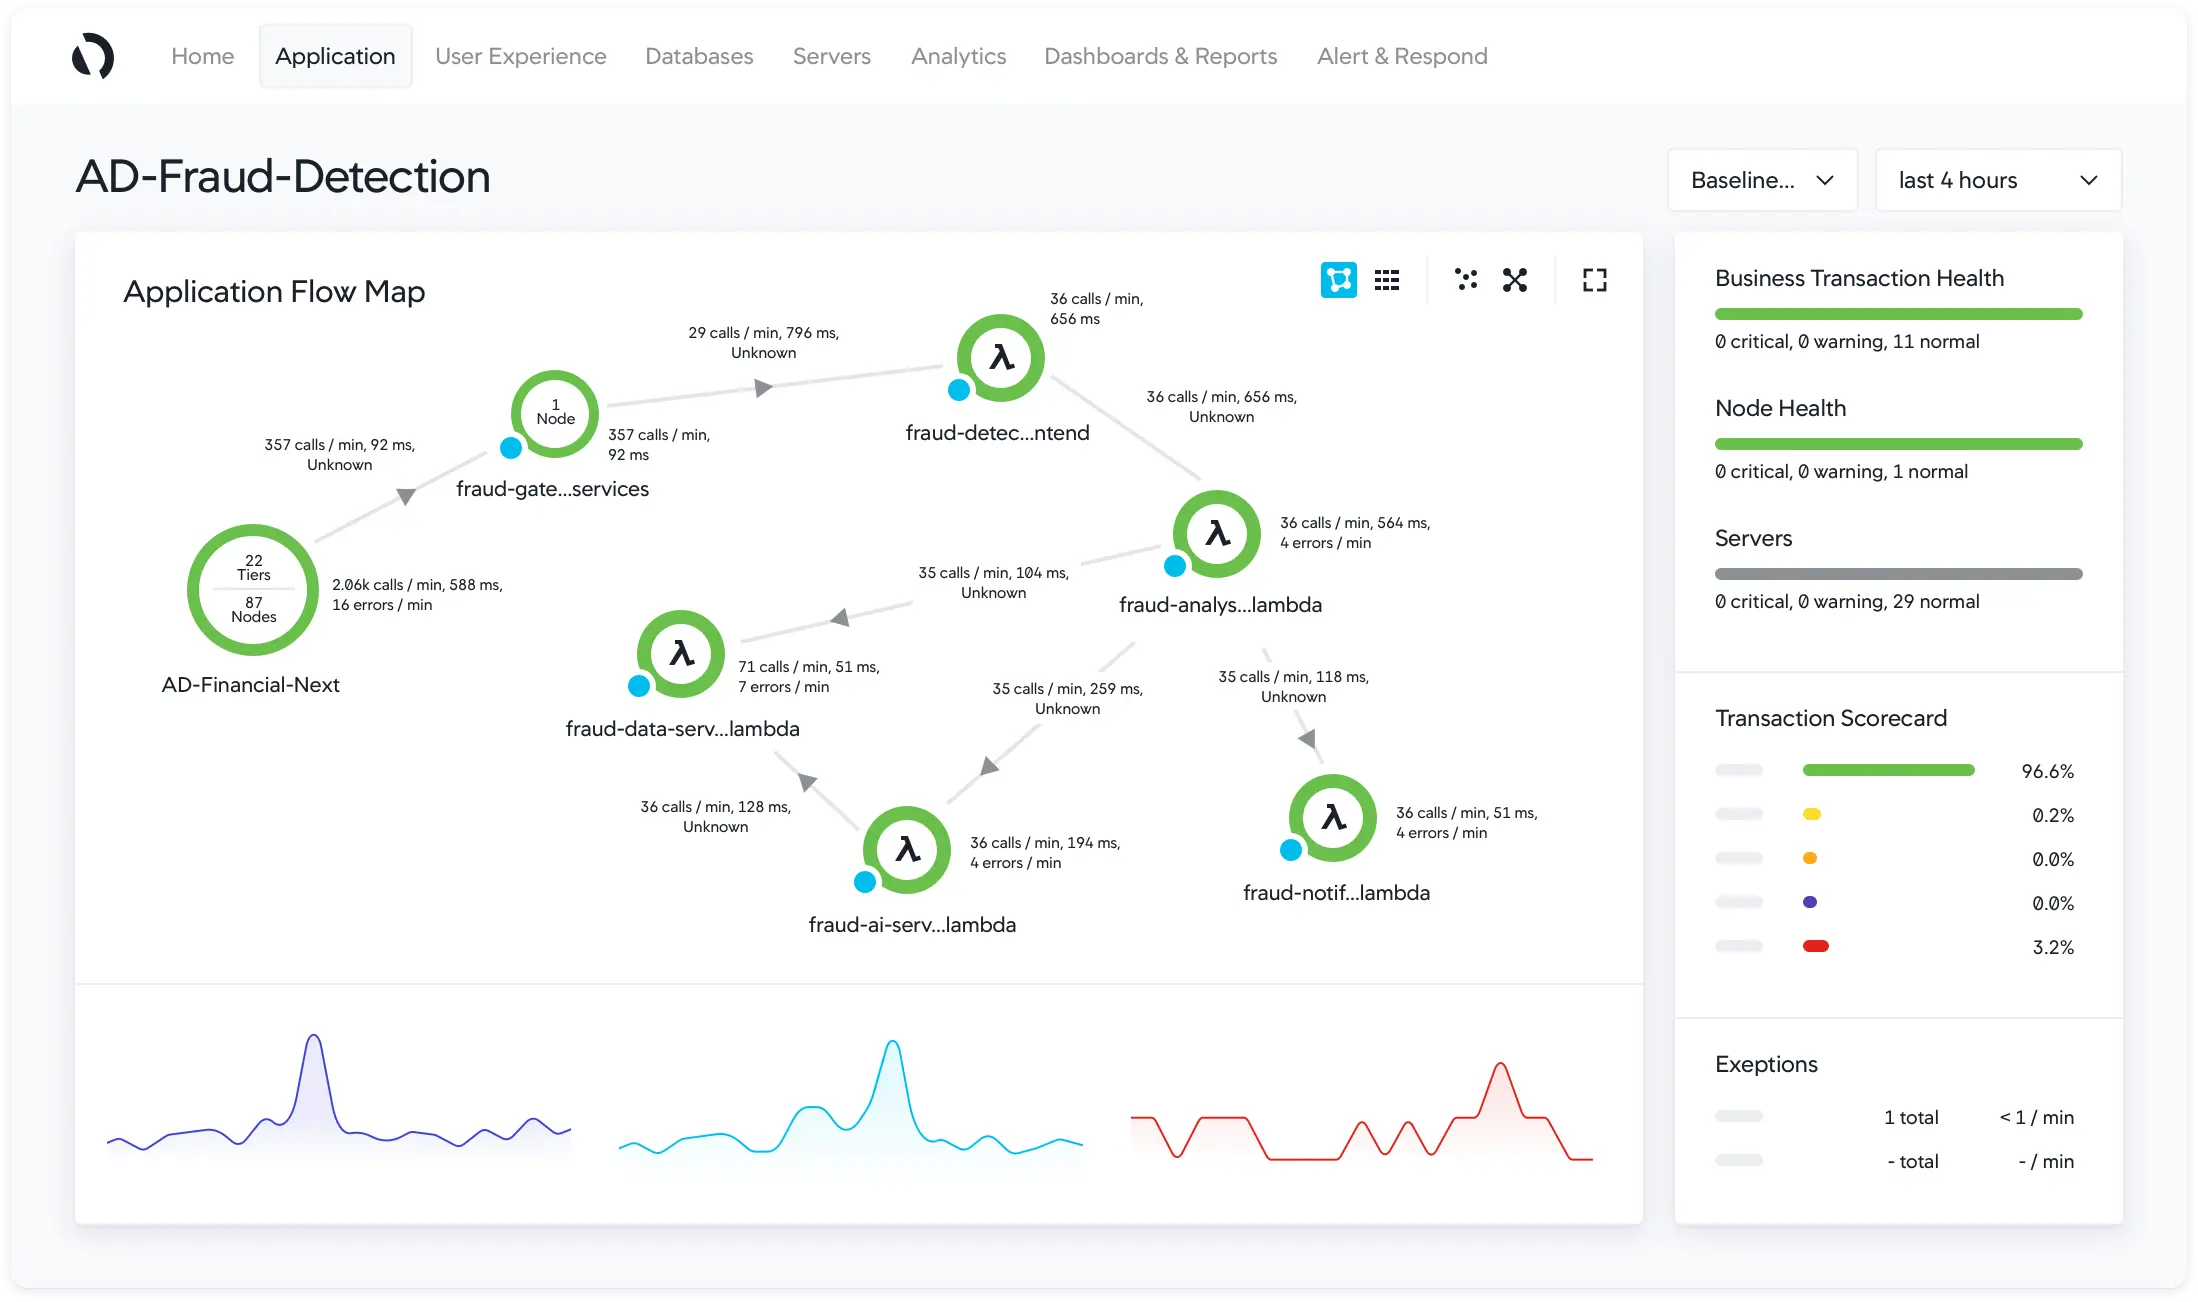
AppDynamics is an extensive SaaS tool and a significant player among Datadog competitors, that promises to correlate business metrics and application performance metrics. It can be used as a good DataDog alternative. Its platform includes an APM tool that provides code-level observability.
Key Features
- Full-Stack Observability: End-to-end visibility across applications, infrastructure and business context
- Business iQ: Correlates technical performance with business metrics
- AI/ML Capabilities: Automated anomaly detection and root cause analysis
- Code-Level Diagnostics: Deep application performance insights
- Multi-Cloud Support: Monitoring for cloud, hybrid and on-premise environment
Pros
- Deep code-level visibility
- Strong business metrics correlation
- Enterprise-grade security
- Extensive language support
- Powerful analytics capabilities
Cons
- Complex initial setup
- Higher price point
- Steep learning curve
- Resource intensive agents
Splunk
Splunk is a software platform designed for searching, monitoring, and analyzing machine-generated data. It's primarily used for log and event data analysis, but its capabilities extend to various types of data, including metrics, security information, and more. Splunk provides a centralized platform where you can collect, index, and visualize data from a wide range of sources, such as servers, applications, network devices, sensors, and websites.
Key Features
- Log Management: Splunk can ingest, index, and store log data from various sources.
- Security Information and Event Management (SIEM): It can be used for security monitoring and threat detection.
- Monitoring and alerting: Splunk can set up real-time alerts based on predefined conditions, helping organizations respond to issues as they occur.
- Unified Data Platform: Centralized collection and analysis of logs, metrics, traces and more
- Advanced Analytics: Powerful search and visualization capabilities
- Security Intelligence: Built-in SIEM functionality and threat detection
- Machine Learning: Automated anomaly detection and predictive analytics
- Real-time Monitoring: Live data ingestion and alerting capabilities
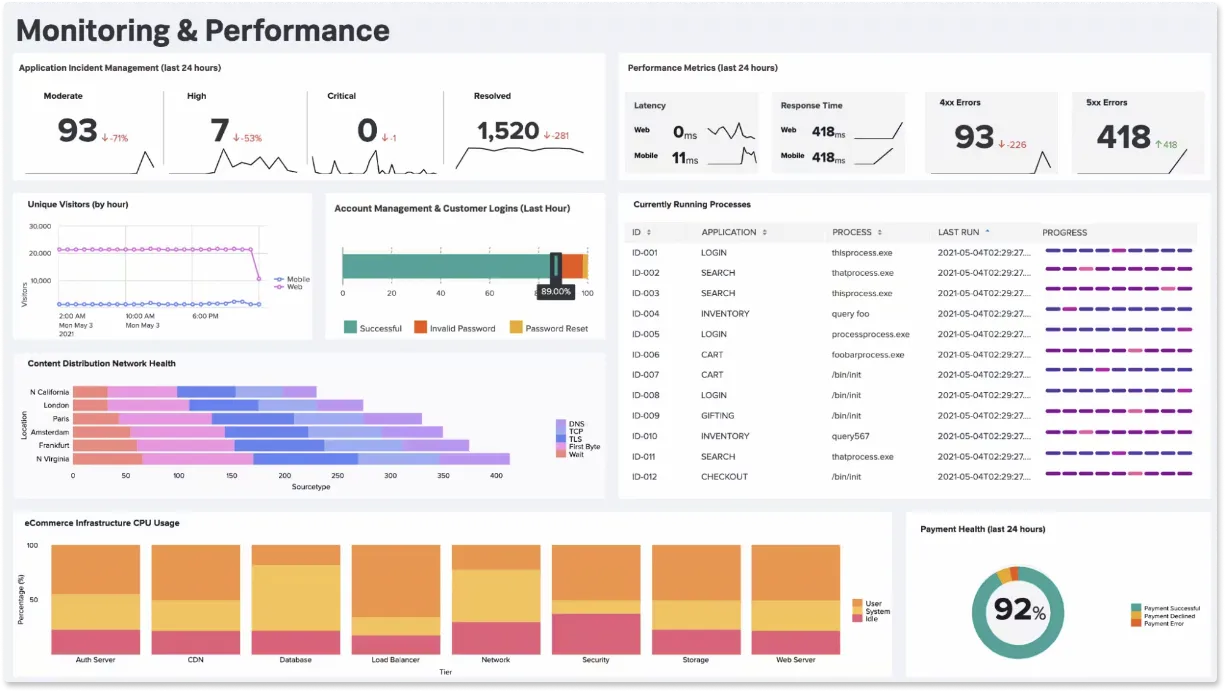
It offers both on-premises and cloud-based solutions, and it has a wide range of apps and integrations to support specific use cases and industries.
Pros
- Powerful search capabilities
- Extensive integration options
- Strong security features
- Flexible deployment options
- Large ecosystem of apps
Cons
- Complex pricing model
- Resource intensive
- Steep learning curve
- Can be expensive at scale
Sematext
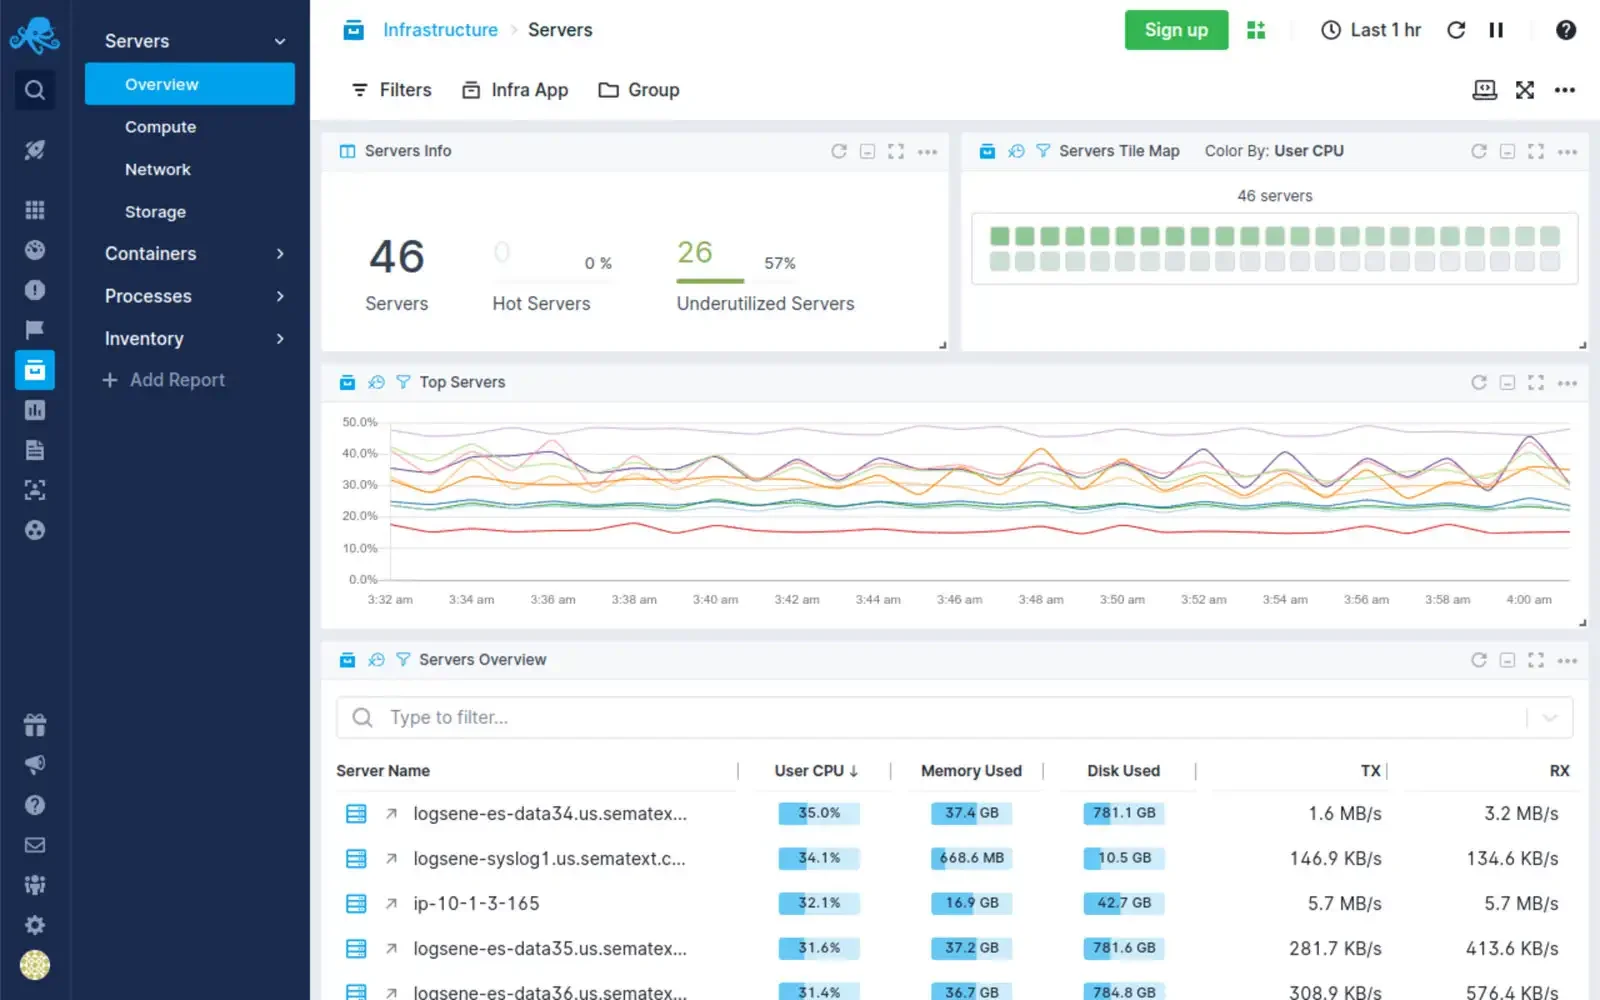
Sematext is a monitoring tool that specializes in providing monitoring, logging, and observability solutions for modern software applications and infrastructure. The company offers a range of tools and services designed to help organizations gain insights into their systems, troubleshoot issues, and improve overall performance.
Key Features
- Metrics Monitoring: Sematext offers monitoring solutions that allow organizations to collect and visualize metrics from various sources, including servers, applications, containers, and cloud services.
- Log Management: Sematext provides log management tools that enable the collection, aggregation, and analysis of log data from different components of an organization's technology stack.
- Tracing and APM: Sematext offers application performance monitoring and tracing capabilities, allowing organizations to trace requests and transactions through their applications.
- Infrastructure Monitoring: Sematext's solutions cover infrastructure monitoring, allowing organizations to monitor server health, resource utilization, and network performance.
Pros
- Easy to set up and use
- Good documentation
- Flexible deployment options
- Competitive pricing
- Built-in alerting
Cons
- Limited third-party integrations
- Basic reporting capabilities
- UI can be improved
- Some features lack depth
Sumo Logic
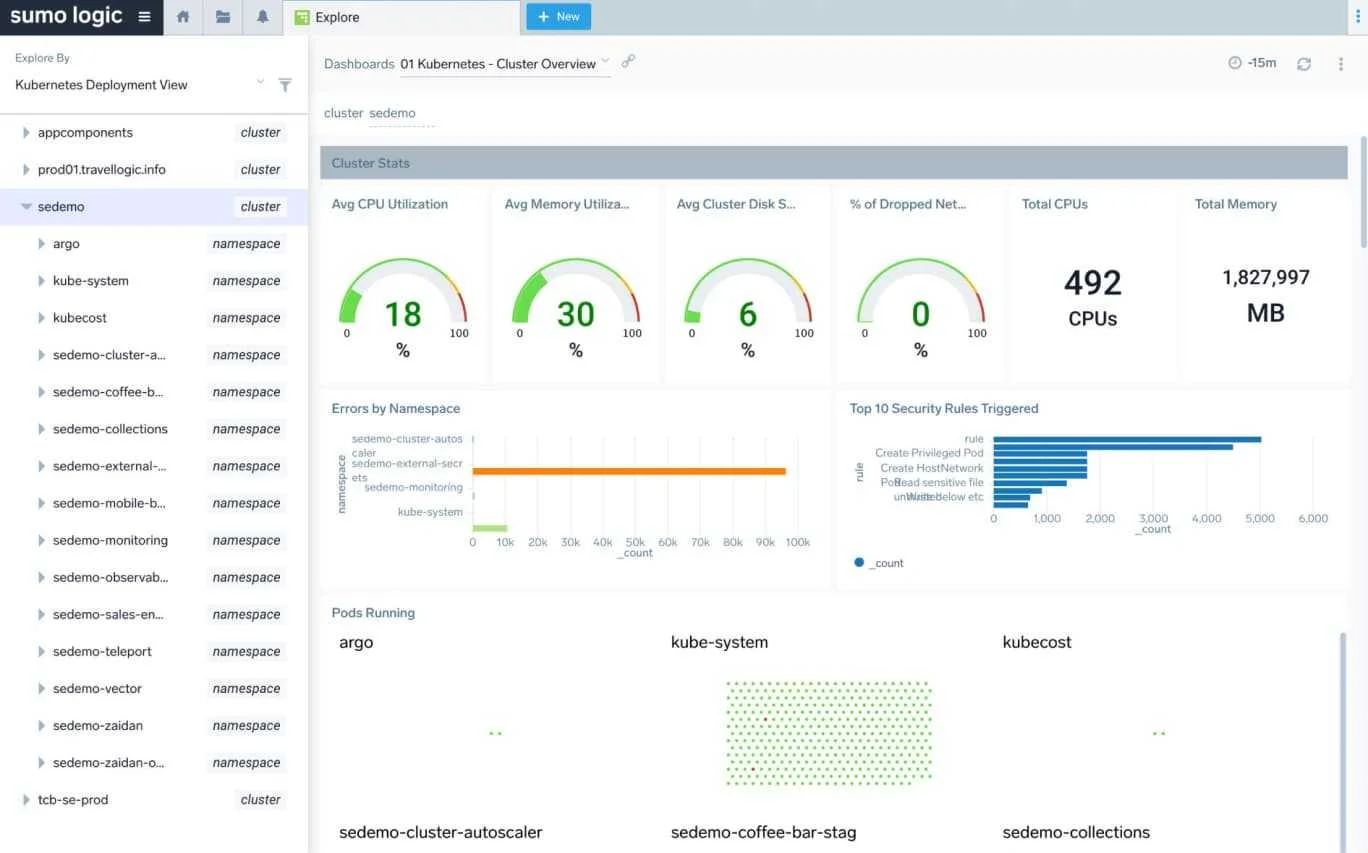
Sumo Logic is a cloud-based log management and analytics platform that helps organizations collect, manage, and analyze data generated by their applications, systems, and infrastructure. It is designed to provide real-time insights into the performance, security, and operational aspects of an organization's IT environment.
Key Features
- Log Management: Sumo Logic allows organizations to centralize the collection and storage of log data from various sources, including servers, applications, cloud services, and network devices.
- Real-Time Monitoring: Sumo Logic provides real-time monitoring and alerting capabilities, enabling organizations to proactively detect and respond to issues as they occur.
- Log Analysis: Users can perform advanced log analysis using Sumo Logic's query language and search capabilities. This allows for the identification of patterns, anomalies, and trends within log data.
- Security Information and Event Management (SIEM): Sumo Logic can be used as a SIEM solution, helping organizations detect and investigate security threats by correlating and analyzing security-related data from logs and other sources.
Pros
- Scalable cloud-based solution
- Real-time monitoring and alerting
- Advanced log analysis capabilities
- Integrated SIEM functionality
Cons
- Can be complex to set up and configure
- Pricing can be high for smaller organizations
- Limited offline capabilities
Choosing the Right Datadog Alternative
If you're looking for a Datadog alternative, you might be frustrated with its billing practices. So it's important to choose a tool that has transparent and predictable pricing policies. For few users, Datadog is just too complex to use with all its bells and whistles.
Monitoring and observability are critical components that you can't ignore for your applications in the production environment. As such, choosing the right tool which can empower you to take actions proactively is very important. Though DataDog is a good tool, it has its own challenges, including cost, unclear pricing policies, and complex UI.
The above DataDog alternatives can be a good option to meet your monitoring needs. If you're moving out of Datadog, a good option can be to move out of closed SaaS vendors and shift towards open source solution. Many application owners are now shifting to OpenTelemetry for their observability data. While tools like Datadog and New Relic claim that they support OpenTelemetry, their support is not first-class. OpenTelemetry is an open-source collection of APIs, SDKs, and tools. It can be used to instrument, generate, collect, and export telemetry data (metrics, logs, and traces) to help you analyze your software's performance and behavior.
Using OpenTelemetry to generate telemetry data frees you from vendor lock-in as it gives you an option to export the data to a backend of your choice. For an OpenTelemetry backend, SigNoz can be a great choice. It is built to support OpenTelemetry data natively.
Getting started with SigNoz
SigNoz cloud is the easiest way to run SigNoz. Sign up for a free account and get 30 days of unlimited access to all features.
You can also install and self-host SigNoz yourself since it is open-source. With 18,000+ GitHub stars, open-source SigNoz is loved by developers. Find the instructions to self-host SigNoz.
FAQs
Who is Datadog's biggest competitor?
Datadog's biggest competitors include open-source solutions like SigNoz, New Relic, and Dynatrace. Each offers unique features and pricing models that appeal to different segments of the market.
Is Datadog better than Splunk?
Datadog and Splunk serve different purposes with some overlap. Datadog excels in cloud infrastructure monitoring and APM, while Splunk is renowned for log management and SIEM. The choice depends on your specific needs. For a comprehensive open-source alternative, consider SigNoz, which integrates metrics, logs, and traces.
How to replace Datadog?
To replace Datadog, you can start by identifying your monitoring and observability requirements. Then, evaluate alternatives like open Source SigNoz, New Relic, Dynatrace, or Grafana based on those requirements. Finally, migrate your monitoring setup to the chosen tool.
What makes Datadog so good?
Datadog is popular due to its comprehensive monitoring capabilities, ease of use, and numerous integrations. Its powerful dashboards and alerting system also contribute to its appeal. However, its complex and unpredictable pricing can be a drawback. For a simpler and cost-effective solution, consider SigNoz, an open-source alternative.
What is the weakness of Datadog?
The primary weakness of Datadog is its complex SKU-based pricing, which can lead to unpredictable and often high costs, especially for smaller organizations.
Can Grafana replace Datadog?
Grafana can replace Datadog for many monitoring and visualization needs, especially when used with its LGTM stack (Loki, Grafana, Tempo, and Mimir). However, it might require more configuration and management effort compared to Datadog's all-in-one solution. For a simpler setup, consider SigNoz, which offers integrated observability with minimal hassle.
Is Datadog SaaS only?
Yes, Datadog is a SaaS-only platform, offering its services via the cloud, which simplifies deployment and scaling for users. For those looking for an open-source alternative that can be deployed on-premise or in the cloud, consider SigNoz.
Is Sentry better than Datadog?
Sentry and Datadog serve different purposes. Sentry focuses on error tracking and performance monitoring for applications, while Datadog offers a broader range of monitoring and observability features. The choice depends on specific needs.
Is Datadog like Grafana?
Datadog and Grafana both provide monitoring and visualization capabilities, but Datadog is an all-in-one SaaS solution, whereas Grafana is often part of an open-source stack requiring more setup and management.
What is the future outlook for Datadog?
The future outlook for Datadog is mixed. While its growth is driven by the increasing adoption of cloud services and the need for observability solutions, its complex pricing and feature overload can be challenging for many users. For those seeking a more streamlined and cost-effective option, SigNoz offers a compelling alternative with its open-source approach and integrated observability features.
Tired of Unpredictable Pricing with DataDog?
SigNoz offers up to 9X ROI compared to DataDog with simple, transparent pricing:
- No user-based pricing
- No host (container or nodes) based pricing
- Simple usage-based pricing
- No special pricing for custom metrics
Read More:


