Both DataDog and Jaeger are tools used to monitor application performance. The difference lies in what they monitor and terms of usage. Jaeger is an open-source tool focused on distributed tracing of requests in a microservice architecture. While DataDog is a SaaS APM vendor covering most monitoring needs of an application.

Application performance monitoring is the process of keeping your app's health in check. APM tools enable you to be proactive about meeting the demands of your customers.
If you're comparing DataDog and Jaeger, distributed tracing capabilities of both tools is one of the important criterion. Before we dive in, let's first understand in brief what is distributed tracing.
What is distributed tracing?
In the world of microservices, a user request travels through hundreds of services before serving a user what they need. To make a business scalable, engineering teams are responsible for particular services with no insight into how the system performs as a whole. And that's where distributed tracing comes into the picture.
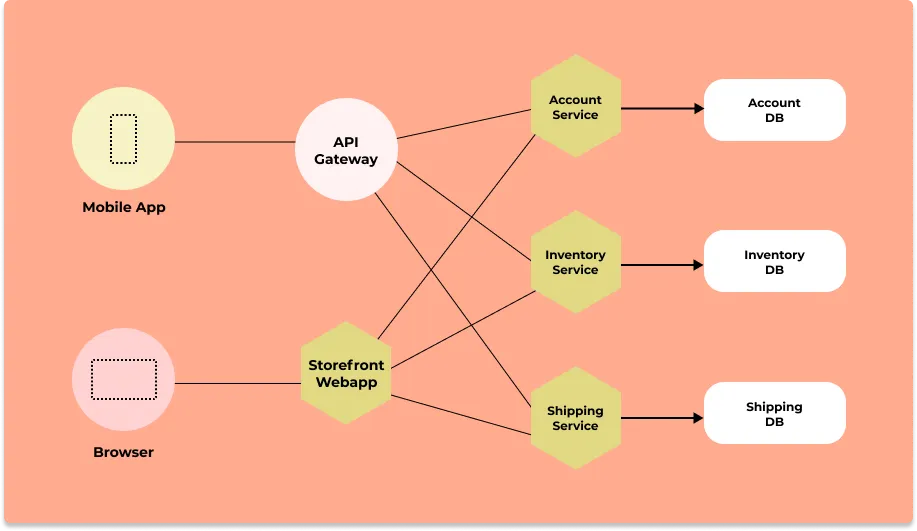
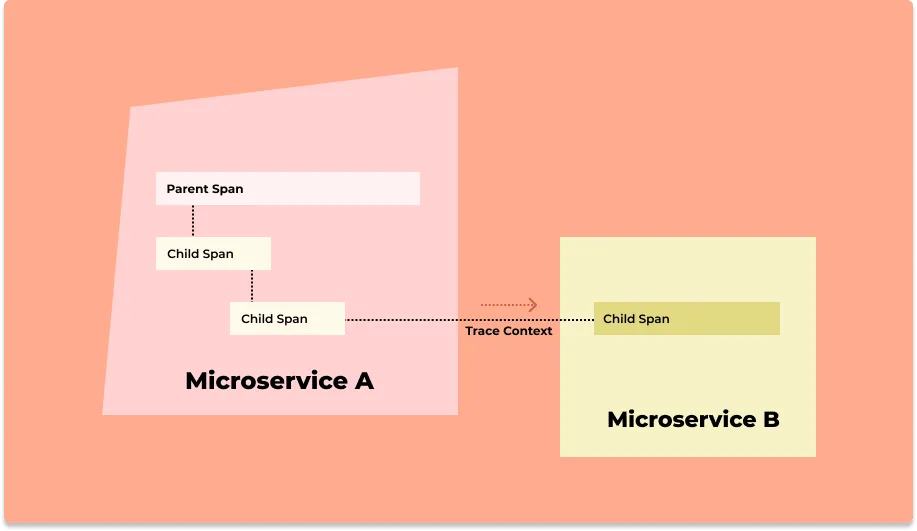
Distributed tracing gives you insight into how a particular service is performing as part of the whole in a distributed software system. There are two essential concepts involved in distributed tracing: Spans and trace context.
User requests are broken down into spans.
What are spans?
Spans represent a single operation within a trace. Thus, it represents work done by a single service which can be broken down further depending on the use case.
A trace context is passed along when requests travel between services, which tracks a user request across services. Thus, you can see how a user request performs across services and identify what exactly needs your attention without manually shifting through multiple dashboards.
Why do we need distributed tracing?
Distributed tracing is essential for various reasons, here are some of them:
- Identification of root causes: When issues occur, distributed tracing enables quick identification of the root cause by tracing the problem back through the chain of services and operations.
- Performance monitoring: Distributed tracing helps in identifying bottlenecks in a request's lifecycle. This is important for optimizing the application's performance and improving user experience.
- Understand service interactions: Distributed tracing maps how services communicate with each other. This visibility is crucial for managing dependencies and ensuring overall system health.
- Correlating Logs and Metrics: Distributed tracing adds context to individual logs and metrics, enabling a holistic view of system behavior.
Key Features of DataDog
DataDog offers an array of services in the monitoring domain. Some of the key areas in monitoring that it covers include:
- Log Management
- Application performance monitoring
- Security monitoring
- Network monitoring
- Real user monitoring
Let's focus on the features of application performance monitoring provided by DataDog as it makes more sense when it comes to comparison with Jaeger.
Some of the key features of DataDog APM includes:
End-to-end application performance monitoring
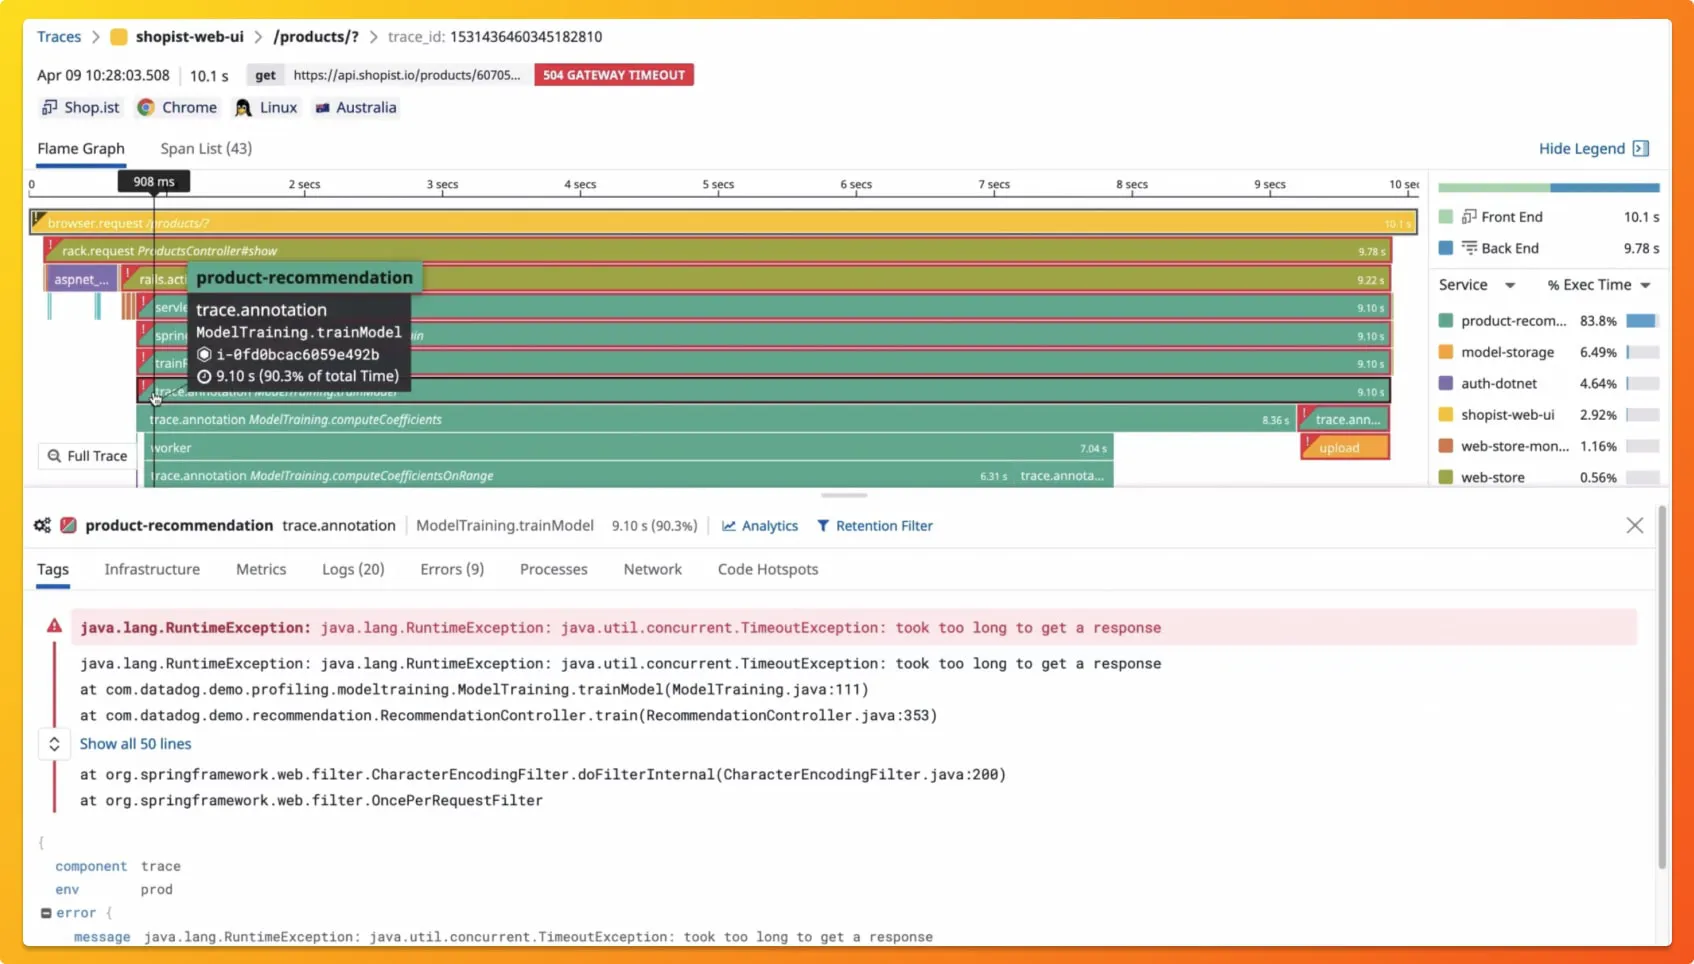
As a full-stack APM tool, using DataDog, you can connect distributed traces to infrastructure metrics, network calls, and live processes.Collection of 100% of traces
Trace data can be huge. Still, using DataDog, you can collect 100% of your traces generated in the last 15 mins. Then, you can retain the traces showing high latency to investigate further.Code-level visibility for root-cause analysis
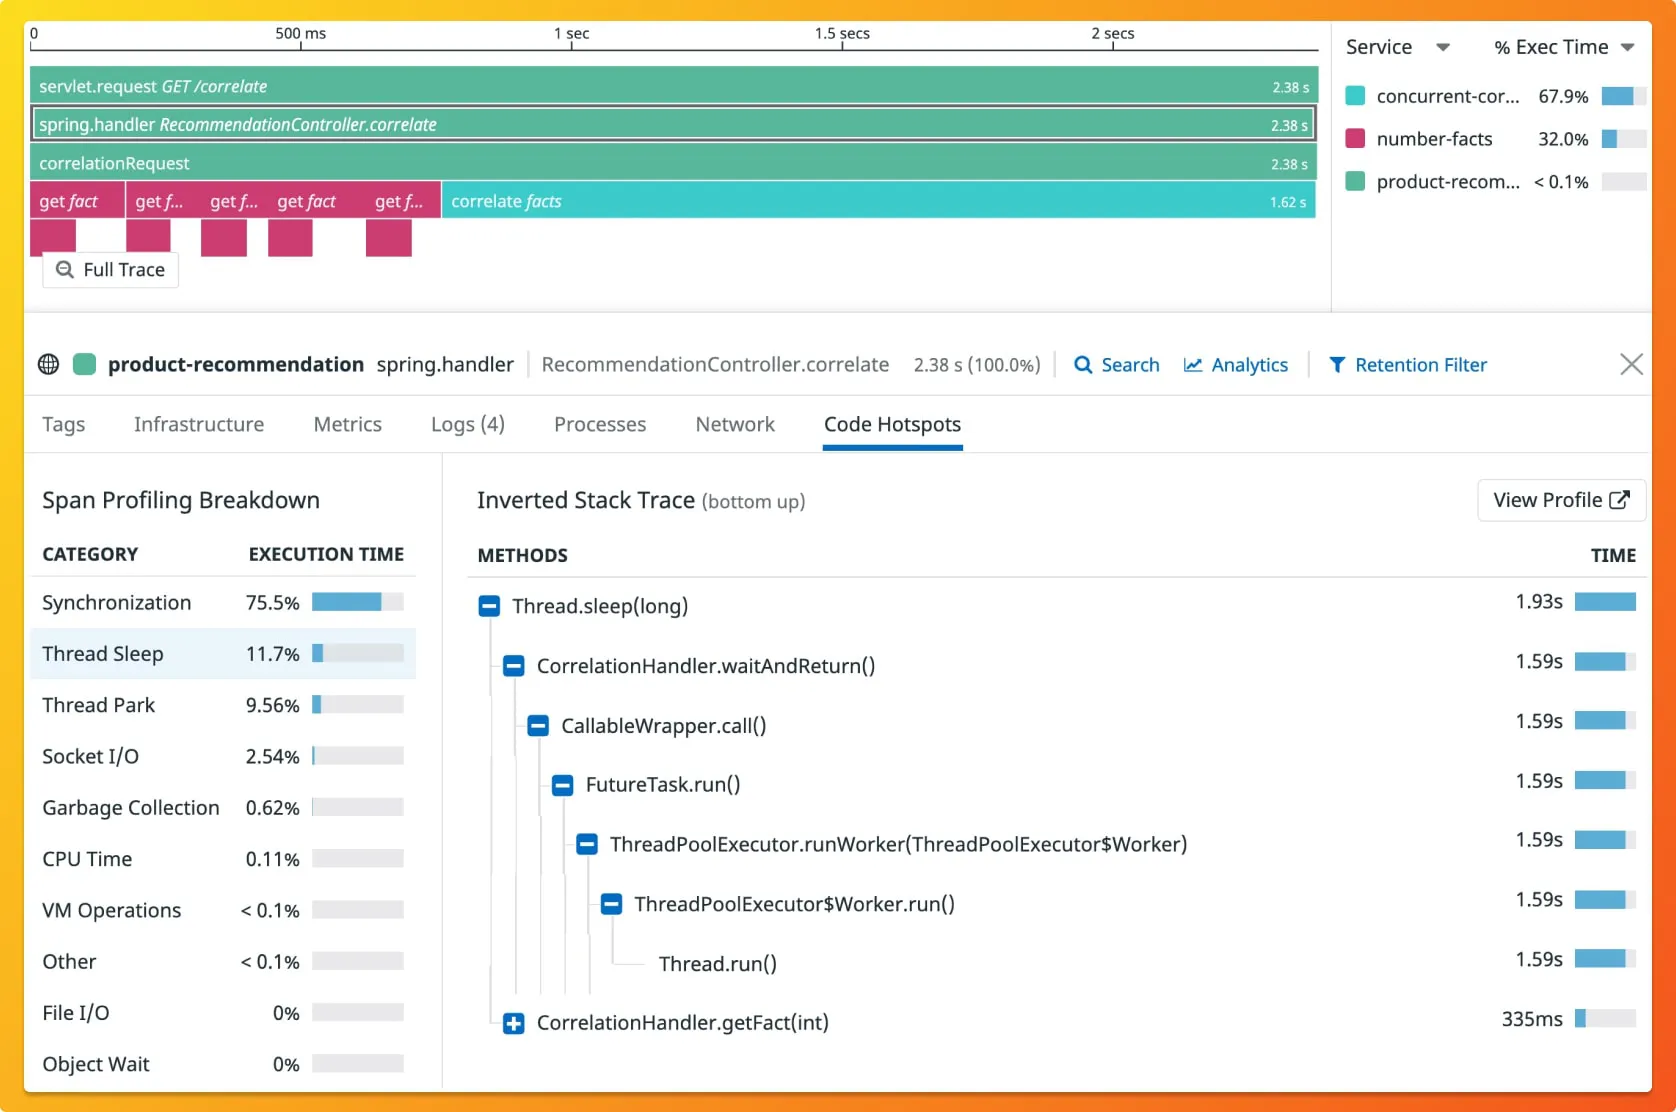
DataDog gives code-level visibility to break down slow requests by time spent on CPU, GC, I/O, etc.Covers wide range of technology stack
DataDog provides extensive integrations and libraries to monitor Java, .NET, PHP, Node.js, Ruby, Python, Go, or C++ applications.
Key features of Jaeger
Jaeger was originally built by teams at Uber and then open-sourced. It is used for end-to-end distributed tracing for microservices. Some of the key features of Jaeger includes:
Distributed context propagation
One of the challenges of distributed systems is to have a standard format for passing context across process boundaries and services. Jaeger provides client libraries that support code instrumentation in multiple languages to propagate context across servicesDistributed transaction monitoring
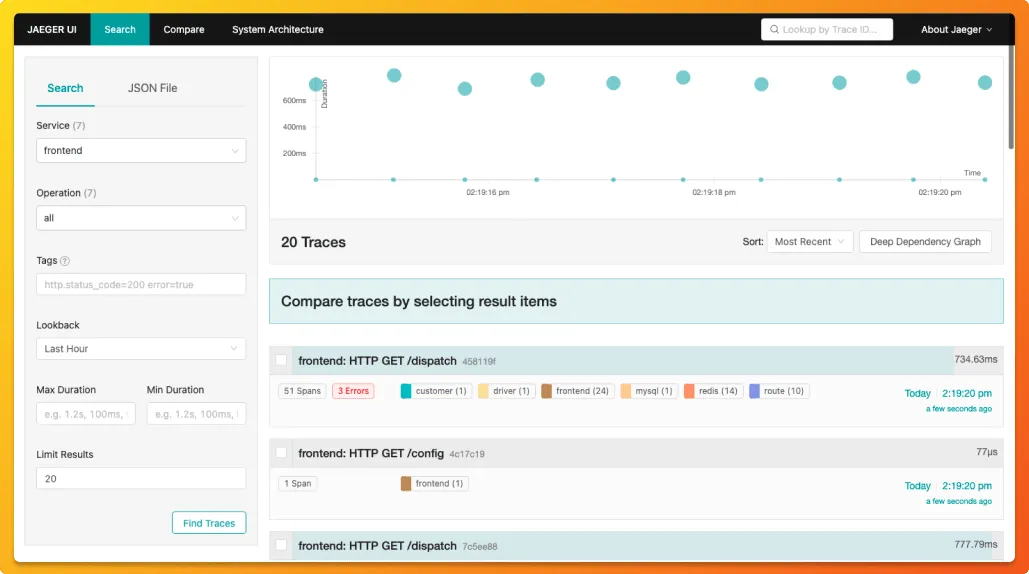
Jaeger comes with a web UI written in Javascript. The dashboard can be used to see traces and spans across services.Root Cause Analysis
Using traces you can drill down to services causing latency in particular user request.Server dependency analysis
Using Jaeger's web UI, you can see how requests flow through different services and different servers interact while serving user requests.Performance/latency optimization
Once you have identified, which service or query is creating latency, you can use the information to optimize it.
Comparing DataDog and Jaeger
DataDog is one of the major SaaS vendors in the APM space. On the other hand, Jaeger is a popular open-source distributed tracing tool that graduated from Cloud Native Computing Foundation. The differences between the tools arise from this genesis.
Some of the key differences between DataDog and Jaeger are:
Correlation of trace data
DataDog lets you connect your trace data to a lot of other performance metrics like infrastructure and host metrics, as it is not limited to distributed tracing. Jaeger collects trace data which can give you insights on latencies of requests. You can't use Jaeger for collecting metrics for hosts, networks, etc.Code Instrumentation
Instrumentation is the process of generating telemetry data from your application. Jaeger uses OpenTracing APIs for code instrumentation. The data format of telemetry data generated is vendor-neutral in the case of Jaeger, and you can also use other back-end analysis tools. DataDog provides DataDog agents which run on your host to collect events and metrics. In the case of proprietary instrumentation agents, your monitoring stack gets locked into a vendor soon. DataDog also supports ingestion from open-source standards like OpenTelemetry, but it's not a first-class citizen.Data Storage
Jaeger offers two popular open-source databases for storing trace data: Cassandra and Elasticsearch. DataDog is a third-party cloud vendor where your data gets stored in DataDog's servers.Web UI
DataDog is a SaaS tool that offers a much smoother and more elaborate dashboarding experience, including many customizations. Jaeger's web UI is limited, although it can serve the purpose of distributed tracing.
The decision between DataDog and Jaeger comes down to whether your organization has the budget to go for a paid SaaS tool like DataDog or does your organization has got the engineering bandwidth to run an open-source tool like Jaeger. In addition, as Jaeger is limited to just distributed tracing, your decision also needs to account for whether you need to monitor other components of your application.
The lack of great user experience in open-source tools has always been there. Also, what if there was an open-source tool that could provide the scope of experience of a great SaaS tool like DataDog.
That's where SigNoz comes into the picture.
Alternative to DataDog and Jaeger - SigNoz
SigNoz is a full-stack open-source application performance monitoring and observability tool which can be used in place of DataDog and Jaeger. It provides advanced distributed tracing capabilities along with metrics under a single dashboard. It provides metrics, traces, and logs under a single pane of glass.
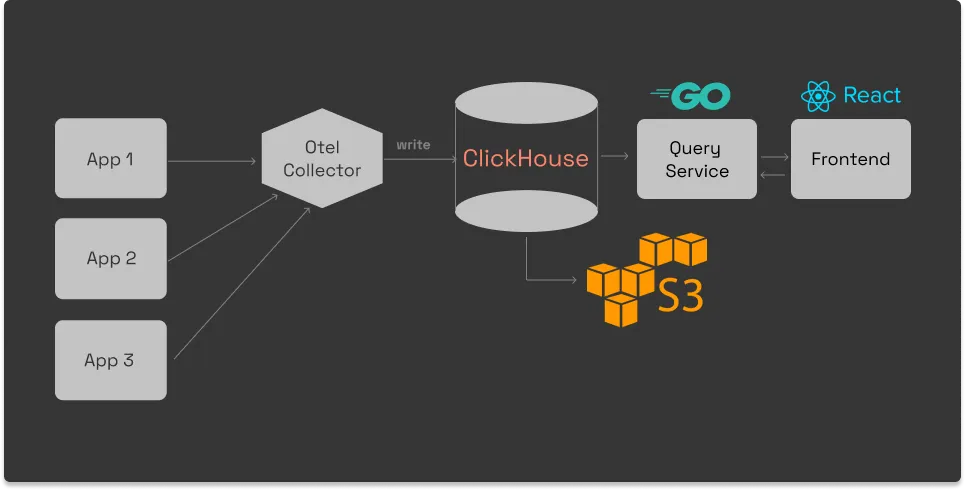
SigNoz is built to support OpenTelemetry natively. OpenTelemetry is becoming the world standard for generating and managing telemetry data (Logs, metrics, and traces). It also provides a fast OLAP datastore, ClickHouse as the storage backend.
SigNoz comes with out of box visualization of things like RED metrics.

You can also use flamegraphs to visualize spans from your trace data. All of this comes out of the box with SigNoz.

Some of the things SigNoz can help you track:
- Out-of-the-box charts for application metrics like p90, p99, latency, error rates, request rates, etc.
- Distributed tracing to get end-to-end visibility of your services
- Monitor any metrics important to you, build dashboards for specific use-cases
- Logs Management equipped with a powerful search and filter query builder
- Exceptions monitoring to track exceptions in your application
- Easy to set alerts with DIY query builder
- Native support for OpenTelemetry native
You can check out SigNoz's GitHub repo here 👇
Related Content


