Modern digital organizations have rapidly adopted microservices-based architecture for their applications. Distributed tracing tools help monitor microservices-based applications. Choosing the right distributed tracing tool is critical. How do you know which is the right one for you? In this post, we will cover the top 15 distributed tracing tools in 2024 that can solve your monitoring and observability needs.
Quick Guide: Choosing a Distributed Tracing Tool and Available Options
- Assess your needs: Consider your application architecture, scale, and specific monitoring requirements.
- Evaluate key features: Look for end-to-end visibility, language support, and integration capabilities.
- Consider open-source vs. commercial: Weigh the benefits of community-driven tools against enterprise support.
- Check OpenTelemetry compatibility: Prioritize tools that support this emerging standard.
- Test and compare: Try out 2-3 tools that best match your criteria before making a final decision.
Comparison of Top Distributed Tracing Tools
| Tool | Type | OpenTelemetry Support | Key Features | Best For | Pricing |
|---|---|---|---|---|---|
| SigNoz | Open-source / Cloud | Full support | Full-stack observability, custom dashboards, alerts | Teams wanting open-source with cloud option | Free (open-source), Pay-as-you-go (cloud) |
| Jaeger | Open-source | Supports | Service dependency analysis, adaptive sampling | Large-scale distributed systems | Free |
| Zipkin | Open-source | Supports | Lightweight, easy to set up, good for small to medium projects | Small to medium-sized projects | Free |
| Grafana Tempo | Open-source / Cloud | Full support | Integration with Grafana ecosystem, cost-effective at scale | Grafana users, cost-conscious enterprises | Free (open-source), Usage-based (cloud) |
| Dynatrace | Commercial | Supports | AI-powered, full-stack observability | Large enterprises | Contact for pricing |
| New Relic | Commercial | Supports | Comprehensive APM suite, real-time analytics | Mid to large-sized businesses | Tiered pricing, free tier available |
| Honeycomb | Commercial | Full support | High-cardinality data analysis, BubbleUp feature | Teams focused on debugging complex systems | Tiered pricing |
| ServiceNow (Lightstep) | Commercial | Full support | AI-powered analysis, correlation engine | Enterprise-level observability | Contact for pricing |
| Datadog | Commercial | Supports | Wide range of integrations, unified platform | DevOps teams in various industries | Tiered pricing |
| Elastic APM | Open-source / Commercial | Supports | Part of ELK stack, machine learning features | Users of Elasticsearch | Free (basic), Tiered pricing for advanced features |
Let’s dive deep in each option below.
What is Distributed Tracing and Why It's Crucial for Microservices
Distributed tracing is a method of tracking and analyzing requests as they flow through distributed systems. It provides a comprehensive view of how different services interact and perform within a microservices architecture. This technique is vital for several reasons:
- End-to-end visibility: Distributed tracing allows you to follow a request from its origin through all the services it touches, providing a complete picture of its journey.
- Performance optimization: By identifying bottlenecks and slow components, you can pinpoint areas for improvement in your system.
- Debugging complexity: Tracing helps you understand the root cause of issues in distributed systems, which can be challenging to debug otherwise.
- Service dependencies: It reveals how different services depend on each other, aiding in architecture decisions and capacity planning.
- Debugging and Troubleshooting: They show the sequence of events leading to a problem, making it easier to find out what went wrong.
- Root Cause Analysis: Tracing tools provide a complete view of a request, helping to identify where and why a failure occurred.
- Complexity Management: In systems with many parts (microservices), tracing helps understand how everything works together, showing how requests move through each microservice.
Without proper tracing, diagnosing problems in microservices can feel like searching for a needle in a haystack. Distributed tracing tools provide the lens you need to see through the complexity of your system.
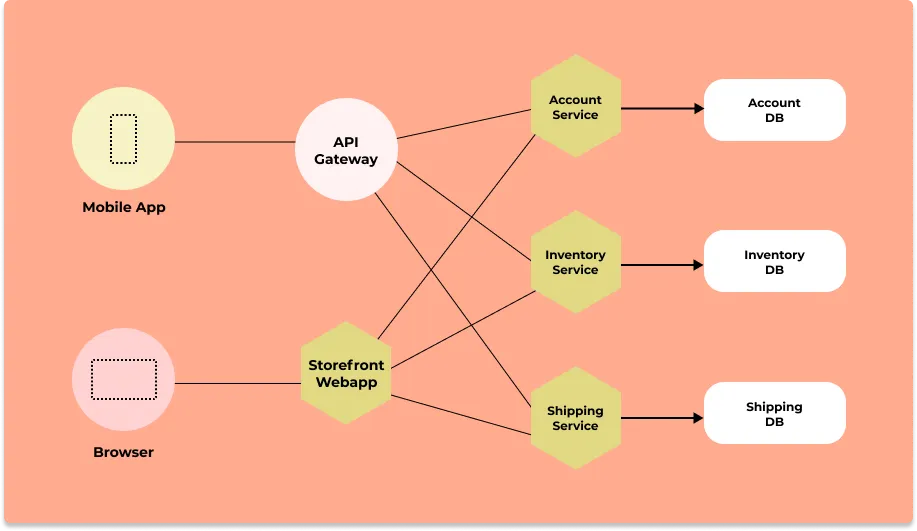
Distributed tracing gives you insight into how a particular service is performing as part of the whole in a distributed software system. There are two essential concepts involved in distributed tracing: Spans and trace context. You can Read our complete guide on Distributed Tracing for a detailed understanding of how it works.
Why is Distributed Software So Popular?
There are three major reasons for the popularity of distributed software:
- Scalability
- Reliability, and
- Maintainability.
But it also comes with its own challenges. Distributed software becomes complex with scale, and no single team can fully comprehend how all services interact. Although engineering teams own single services, they become implicitly responsible for many services.
A single user request can travel through hundreds or thousands of microservices. So to quickly identify where things are going wrong, you need a central overview of how requests are performing across services.
Distributed tracing tools capture user requests as they travel through every service and measure things like latency.
A great distributed tracing tool can improve your team's response to performance issues, thereby improving the end-user experience.
Key Features to Look for in Distributed Tracing Tools
When evaluating distributed tracing tools, consider these essential features:
- End-to-end visibility: The ability to trace requests across all services and components in your system.
- Language and framework support: Compatibility with the programming languages and frameworks you use.
- Integration capabilities: Seamless integration with your existing monitoring and observability stack.
- Scalability: The capacity to handle high volumes of trace data in production environments.
- Data visualization: Intuitive dashboards and service maps for easy analysis.
- Sampling techniques: Methods to manage data volume without losing critical information.
- OpenTelemetry support: Compatibility with the emerging open standard for instrumentation.
These features ensure that your chosen tool will provide comprehensive insights into your microservices architecture.
Top 15 Distributed Tracing Tools
Now let's explore the top 15 distributed tracing tools in 2024.
SigNoz (Open-Source)

Spans of a trace visualized with the help of flamegraphs and gantt charts in SigNoz dashboard
SigNoz is a full-stack distributed tracing tool that you can use for tracing your application. You can monitor logs, metrics, and traces and correlate signals for better insights into application performance. Logs, metrics, and traces are considered to be the three pillars of observability in modern-day distributed systems.
SigNoz is a very good choice for distributed tracing based on OpenTelemetry. With SigNoz, you can do the following:
- Visualise Traces, Metrics, and Logs in a single pane of glass
- Monitor application metrics like p99 latency, error rates for your services, external API calls, and individual endpoints.
- Find the root cause of the problem by going to the exact traces which are causing the problem and see detailed flamegraphs of individual request traces.
- Run aggregates on trace data to get business-relevant metrics
- Filter and query logs, build dashboards and alerts based on attributes in logs
- Monitor infrastructure metrics such as CPU utilization or memory usage
- Record exceptions automatically in Python, Java, Ruby, and Javascript
- Easy to set alerts with DIY query builder
SigNoz is a great fit for engineering teams looking for an open-source distributed tracing tool. SigNoz also offers cloud and enterprise plans. This makes it a great choice for teams that want the flexibility of having their dev and staging environment on open-source and their prod services monitored by SigNoz cloud.
SigNoz uses OpenTelemetry for code instrumentation. OpenTelemetry provides vendor-agnostic instrumentation libraries and is quietly becoming the world standard for generating and managing telemetry data.
Jaeger (Open-Source)
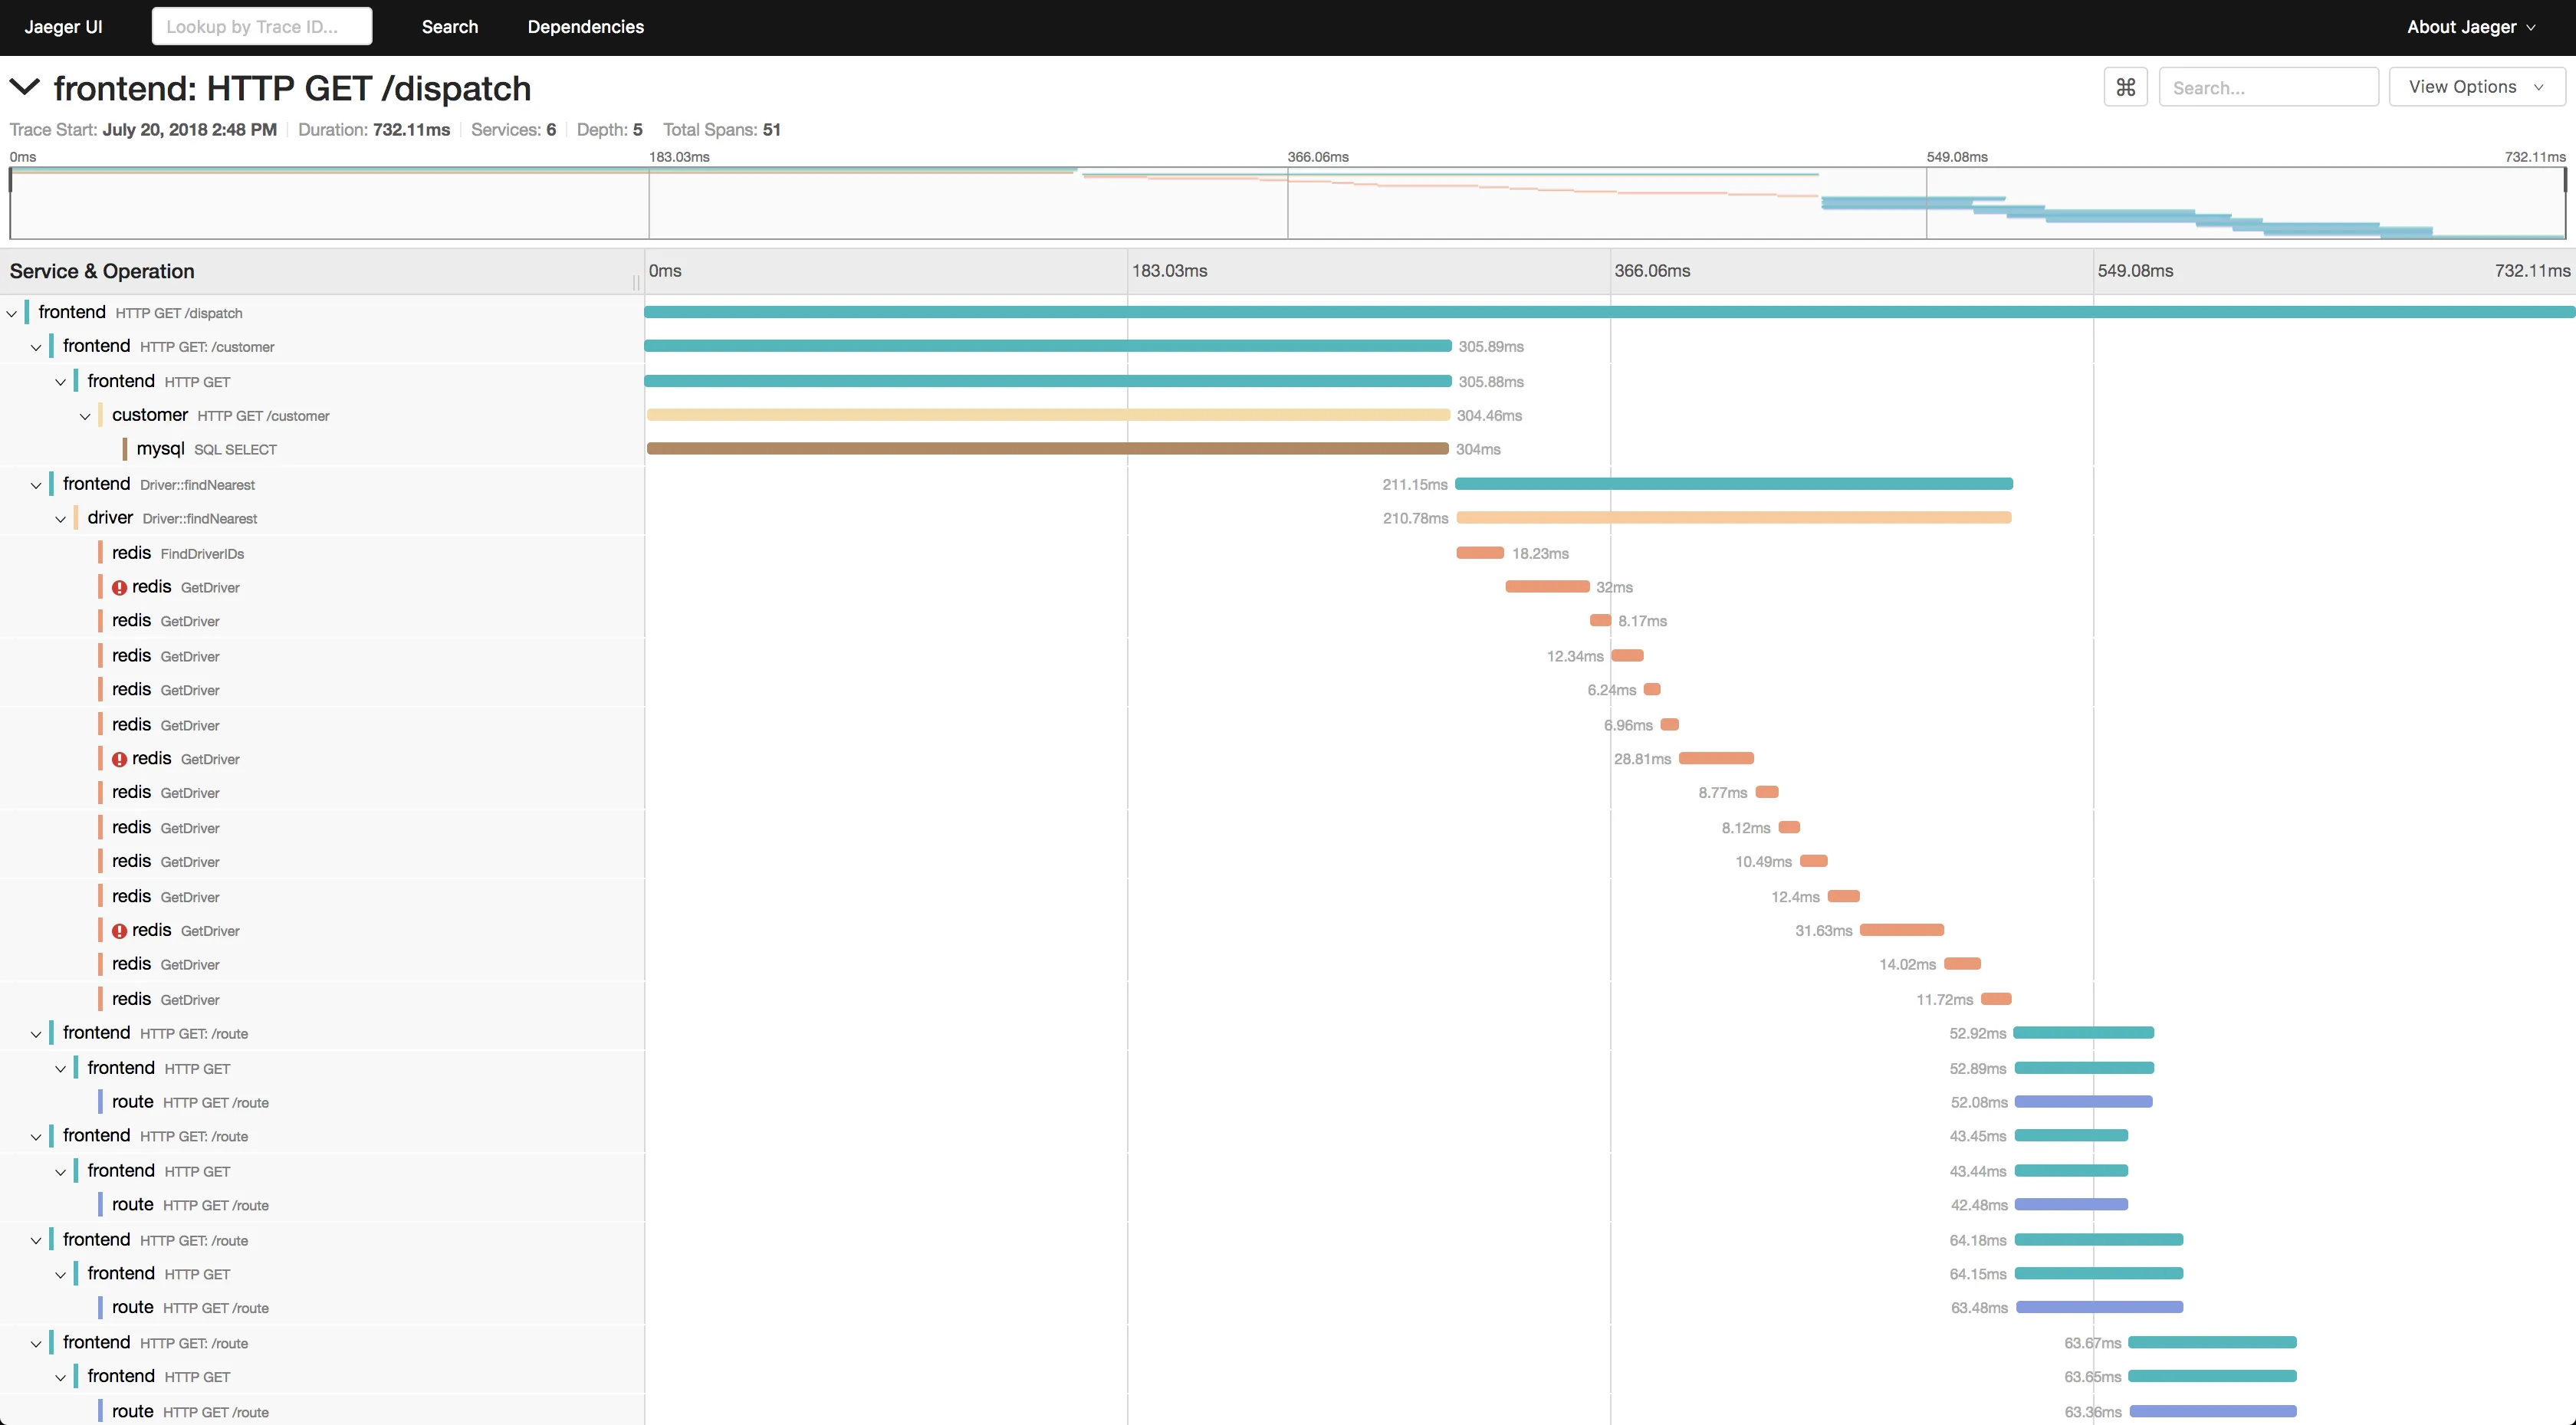
Jaeger is an open-source APM tool developed at Uber, later donated to Cloud Native Computing Foundation(CNCF). Inspired by Google's Dapper, Jaeger is a distributed tracing system.
It is used for monitoring and troubleshooting microservices-based distributed systems. Some of its key features include:
- Distributed context propagation
- Distributed transaction monitoring
- Root cause analysis
- Service dependency analysis
- Performance / latency optimization
Jaeger supports two popular open-source NoSQL databases as trace storage backends: Cassandra and Elasticsearch. Jaeger's UI can be used to see individual traces. You can also filter the traces based on service, duration, and tags. However, Jaeger's UI is a bit limited for users looking to do more sophisticated data analysis.
Zipkin (Open-Source)
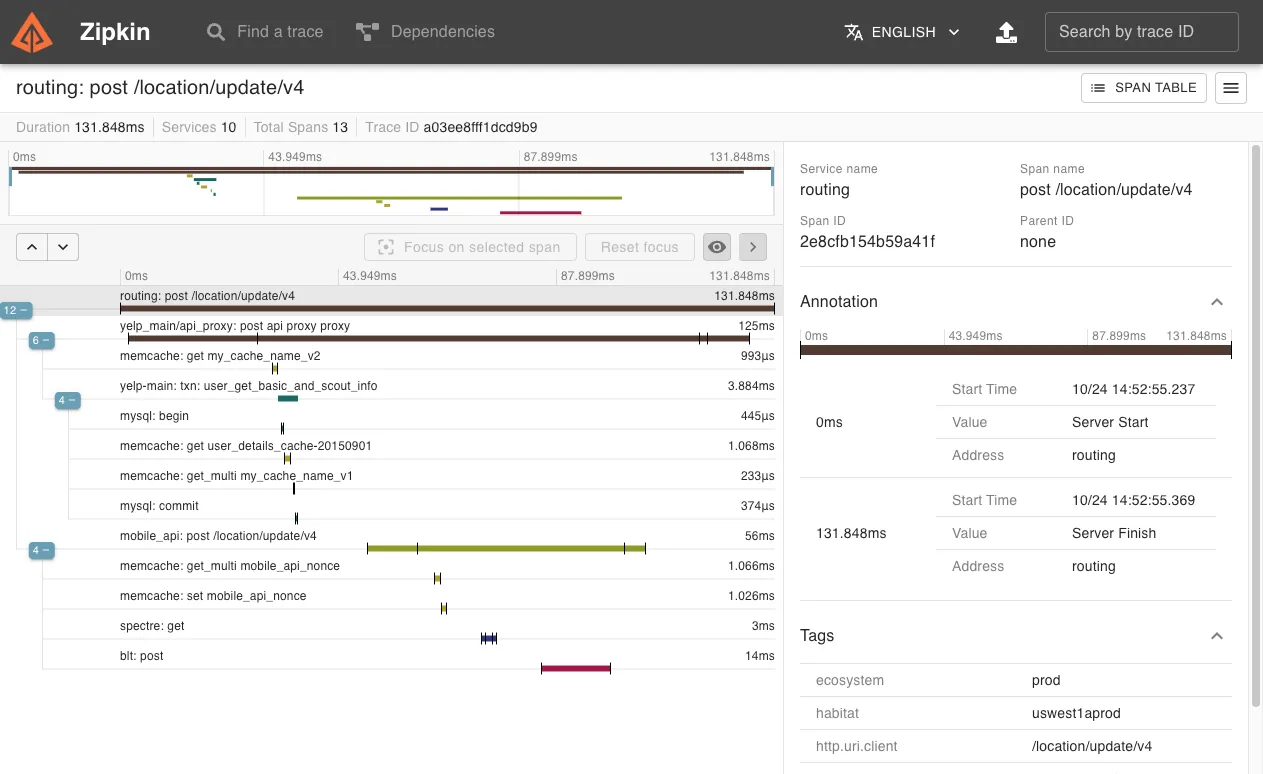
Zipkin is an open-source APM tool used for distributed tracing. Zipkin captures timing data need to troubleshoot latency problems in service architectures.
Zipikin was initially developed at Twitter and drew inspiration from Google's Dapper. Unique identifiers called Trace ID are attached to each request which then identifies that request across services.
Zipkin's architecture includes:
- Reporters to send data to Zipkin
- Collectors which persist trace data to storage
- API to query data
- UI
Zipkin's in-built UI is limited, and you can use Grafana or Kibana from the ELK stack for better analytics and visualizations.
It also includes a dependency diagram that shows how many user requests went through each service. It can help you to identify error paths and calls to deprecated services.
Grafana Tempo
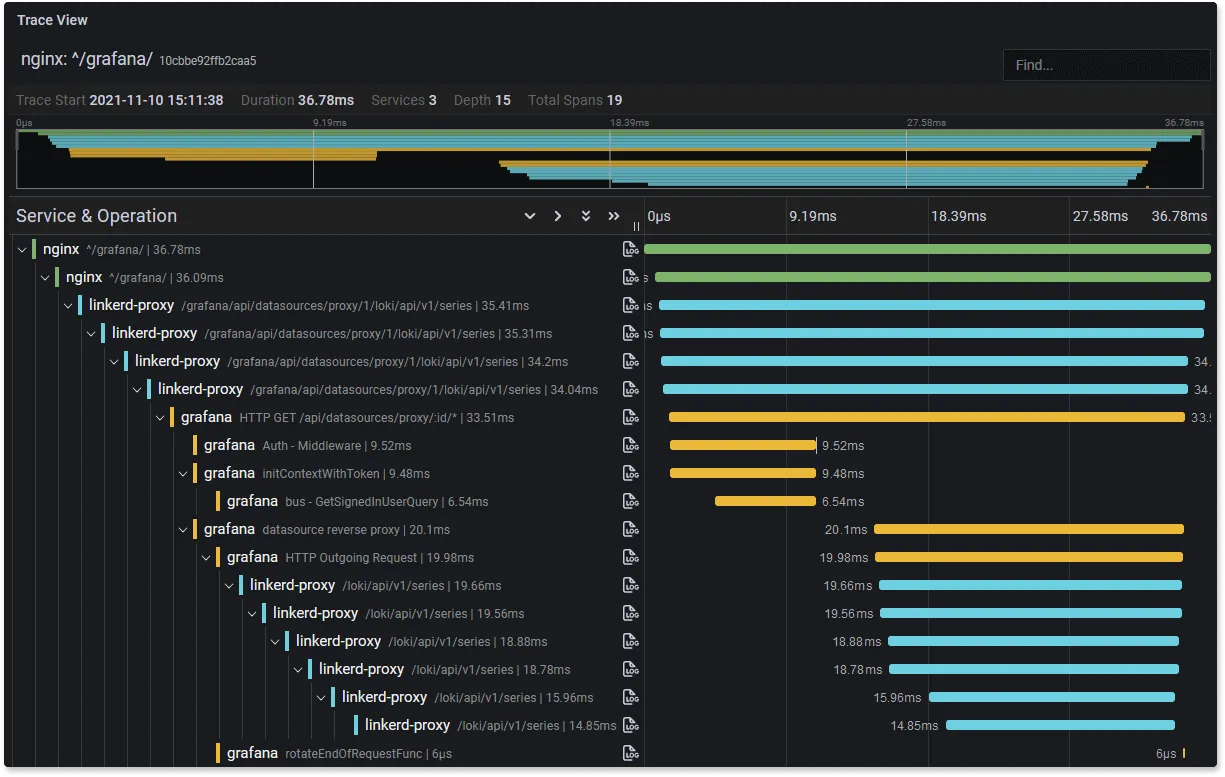
Grafana Tempo is an open-source tracing backend which was started by Grafana Labs. It was announced at Grafana ObservabilityCON in October 2020, and became generally available in June 2021.
Some of the key features of Grafana Tempo includes:
- compatible with popular open source tracing protocols like Zipkin and Jaeger
- Supported by Grafana as a separate data source for trace visualizations
- Available as self-hosted and cloud version
- Provides service graph
Serverless360
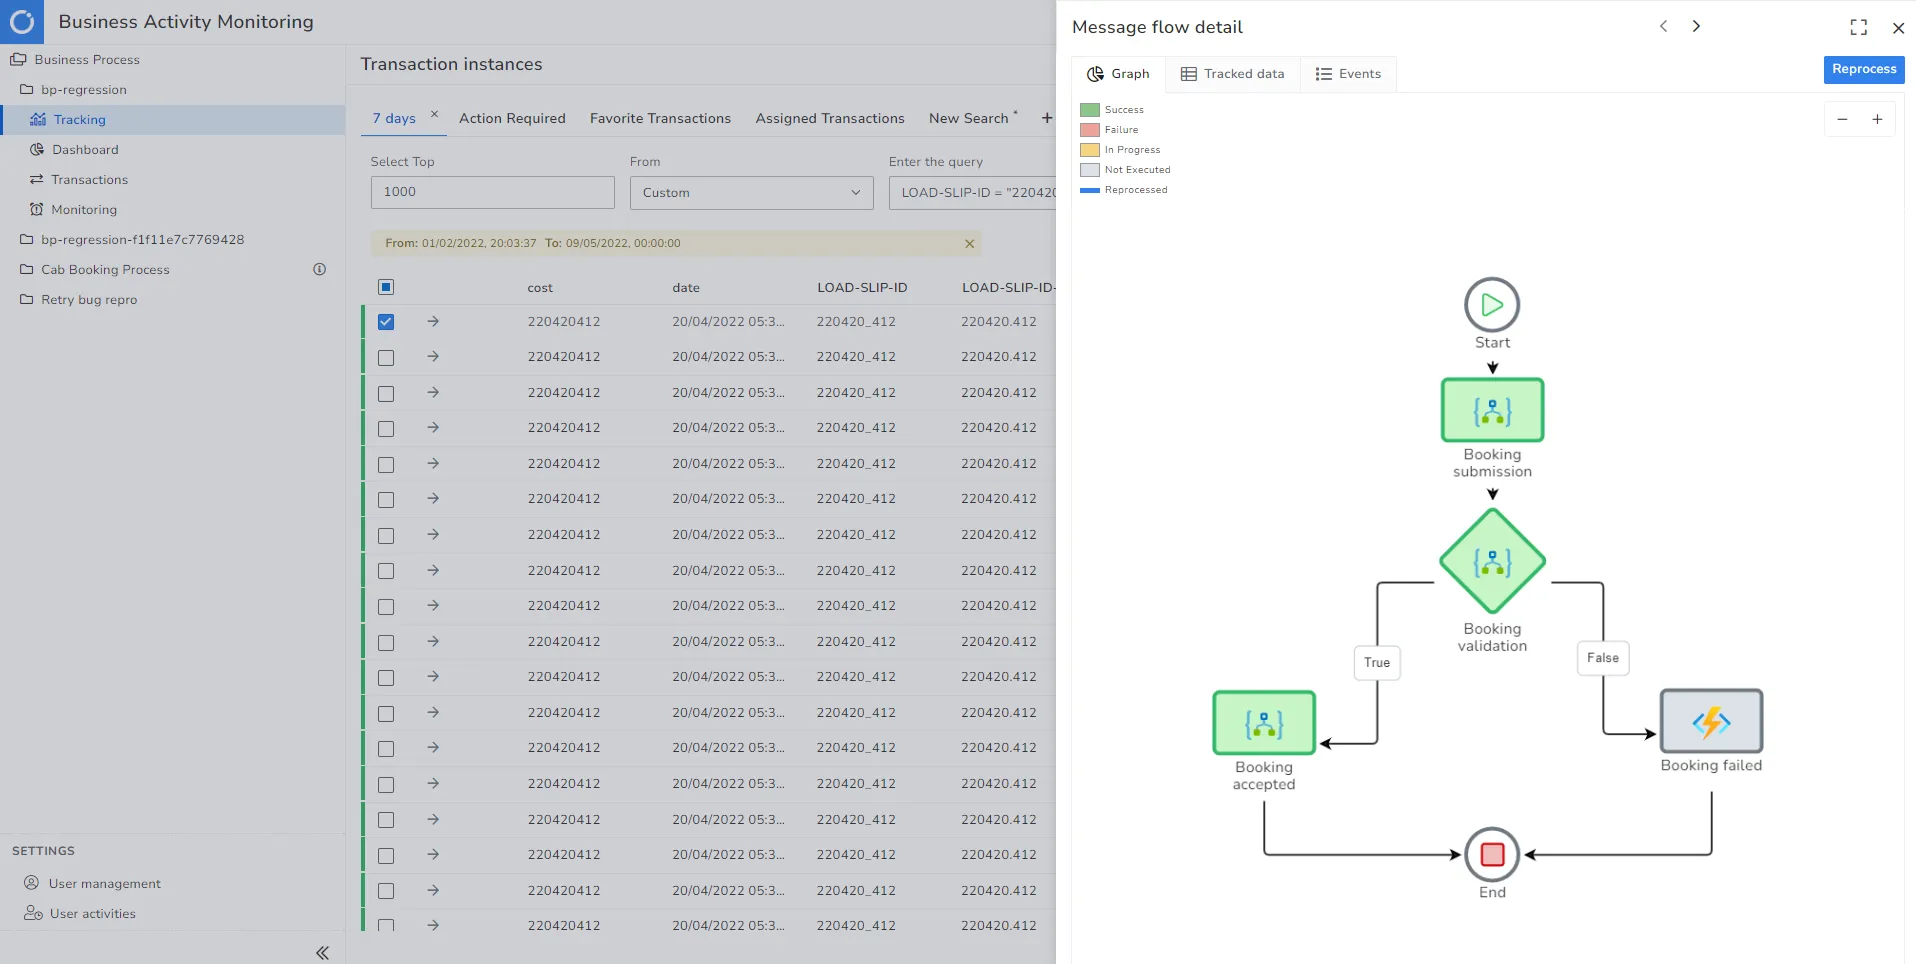
Serverless360 is an enterprise tool ideal for distributed tracing in cloud-native and hybrid microservice architectures.
For distributed tracing, it provides checkpoints that act as a milestone and indicate the business process's completion. It provides message-level insights, including the metadata and properties of the message flowing across the applications.
The platform provides a simplified end-to-end representation of underlying complex architecture, to help the business users and support operators troubleshoot bottlenecks at ease.
Some of its key features include:
- End-to-end tracking of message flow
- Intuitive UI to see individual transactions with an advanced filter on Id, tags, property names, durations & more
- Provides simplified live performance tracking for microservices
- Ideal for scenarios like correlation, dynamic reprocessing, de-batching transactions, and more
- Facilitates team collaboration in resolving issues.
With Serverless360 BAM, track key properties and allow users to locate a transaction by querying for the property value. This also enables dynamic monitoring of transaction exceptions and any violations in the threshold limits set.
Dynatrace
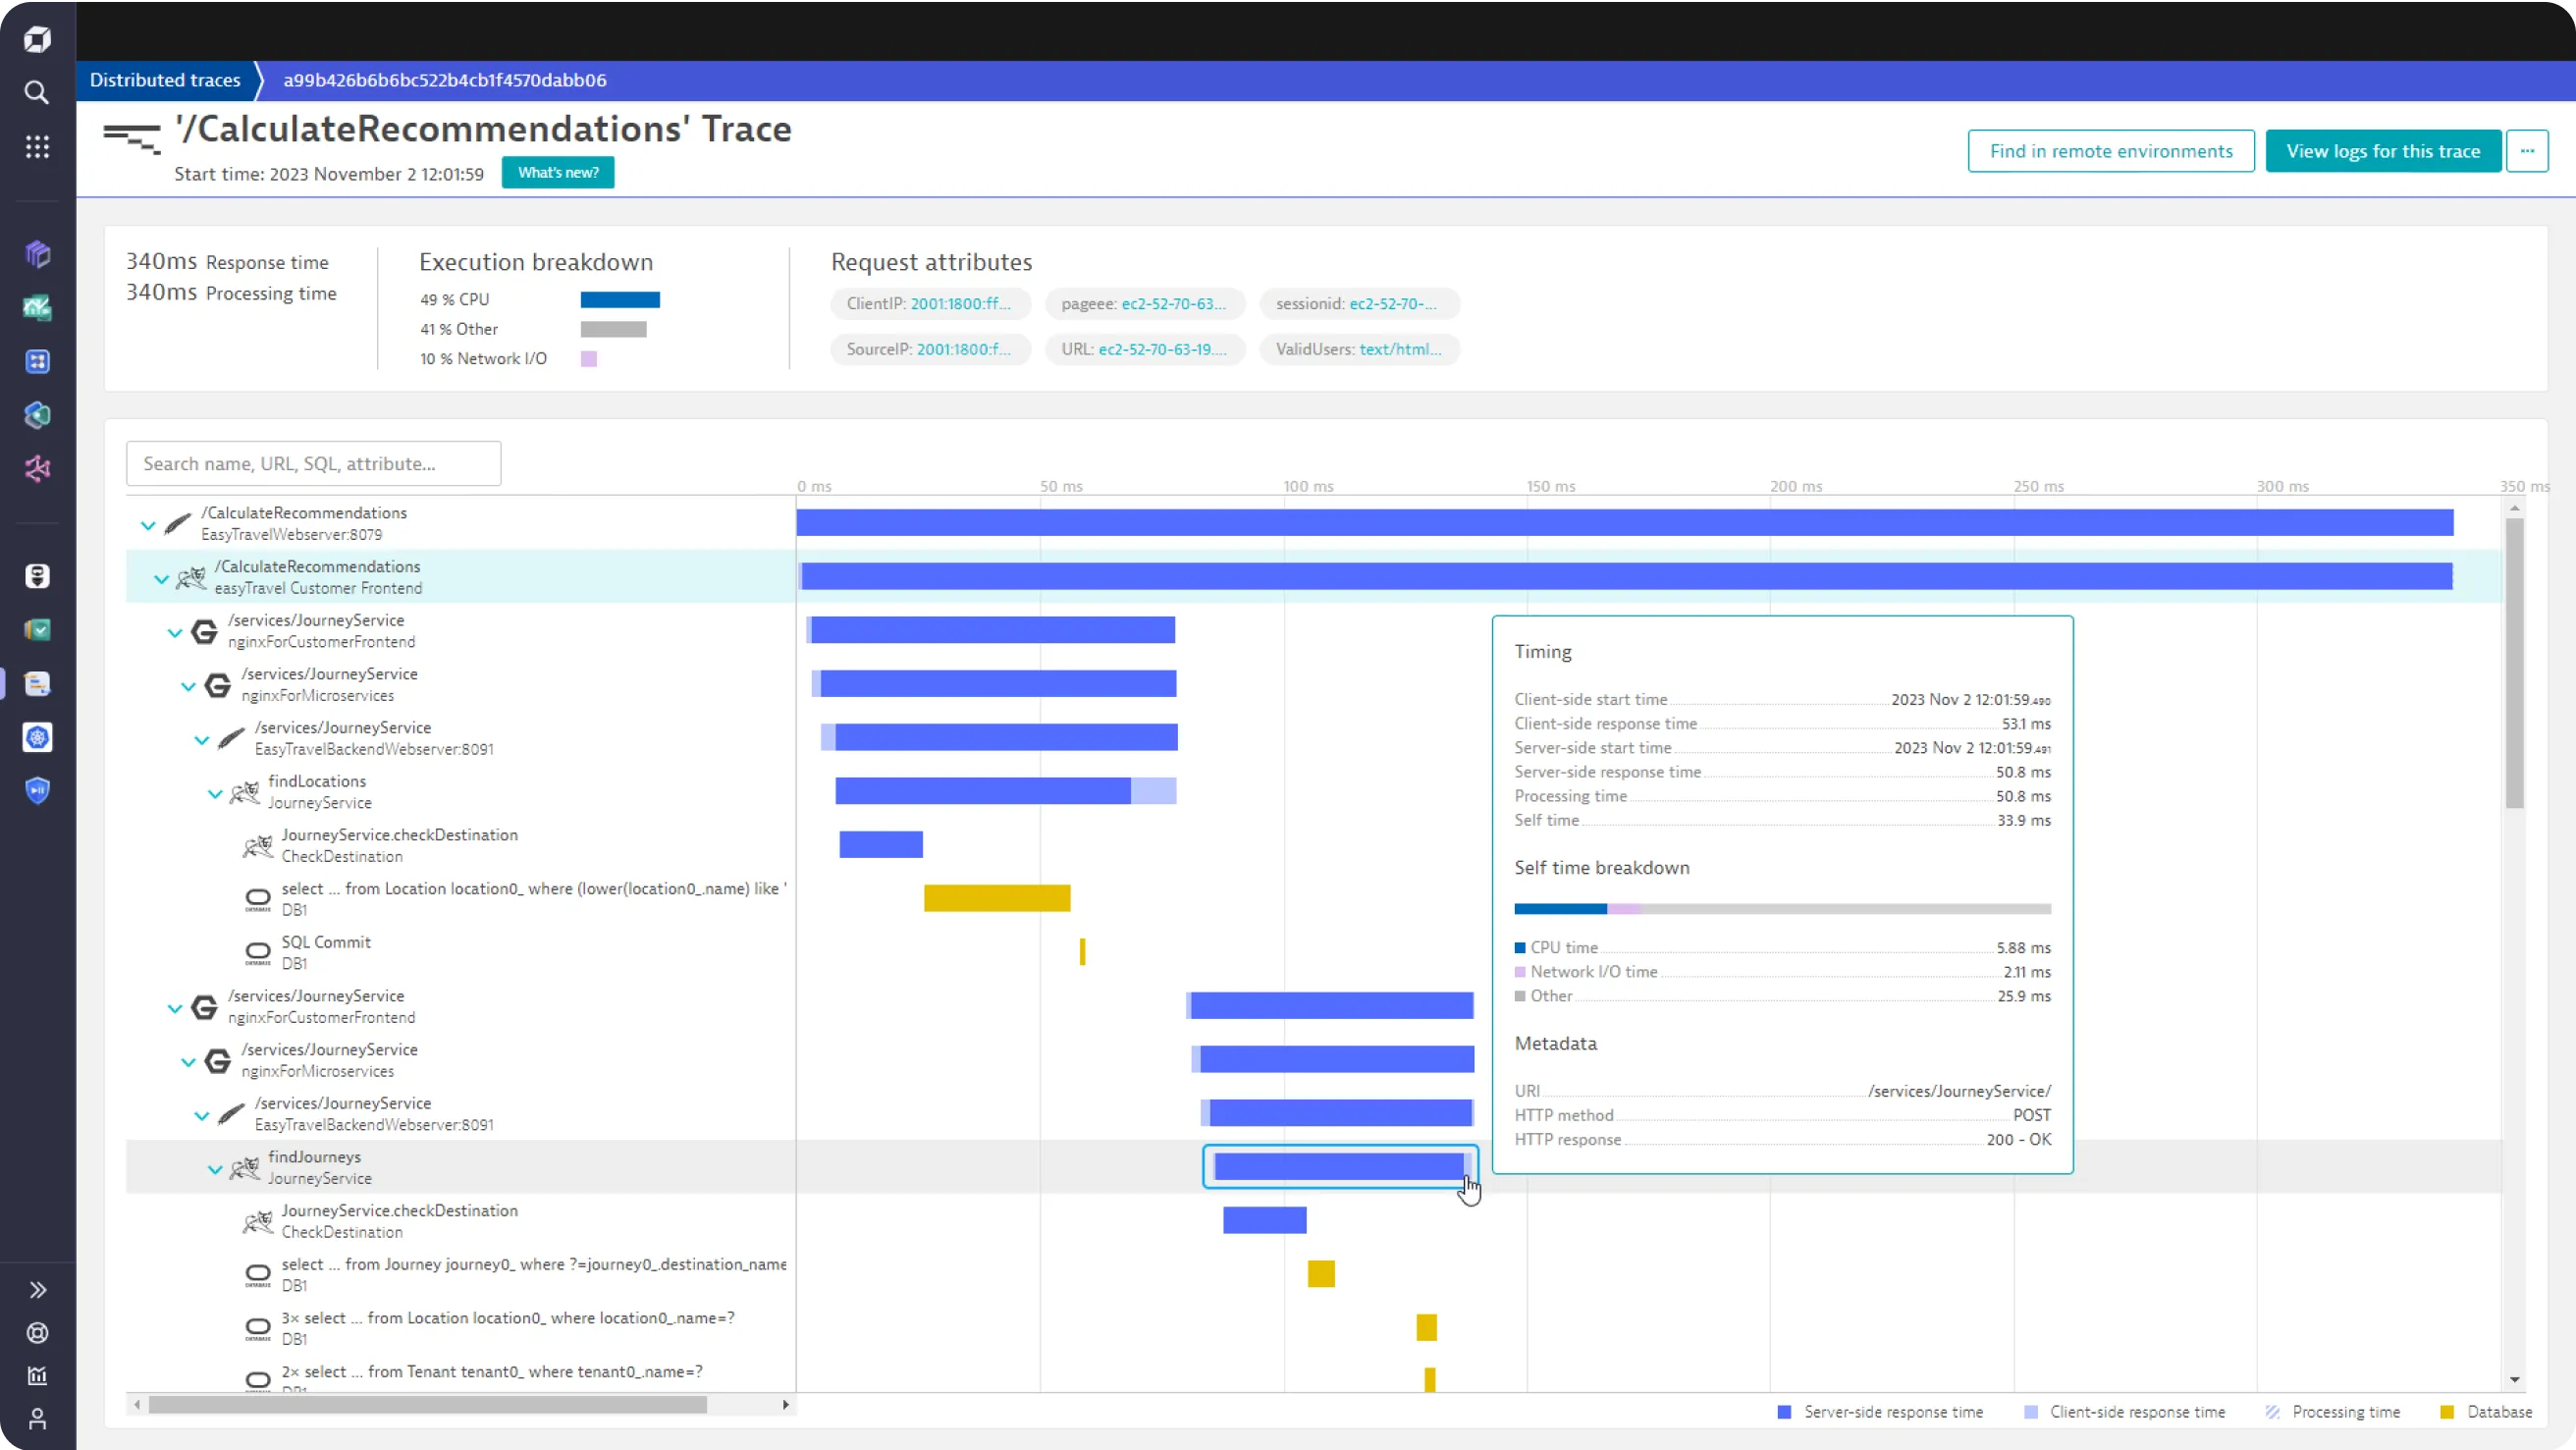
Dynatrace is an extensive SaaS enterprise tool targeting a broad spectrum of monitoring needs of large-scale enterprises. For distributed tracing, it provides a technology called Purepath, which combines distributed tracing with code-level insights. When a user initiates a transaction with the application, PurePath gives the transaction a unique ID.
Some of the key features provided by the Dynatrace distributed tracing tool includes:
- Automatic injection and collection of data
- Code-level visibility across all application tiers for web and mobile apps together
- Always-on code profiling and diagnostics tools for application analysis
New Relic
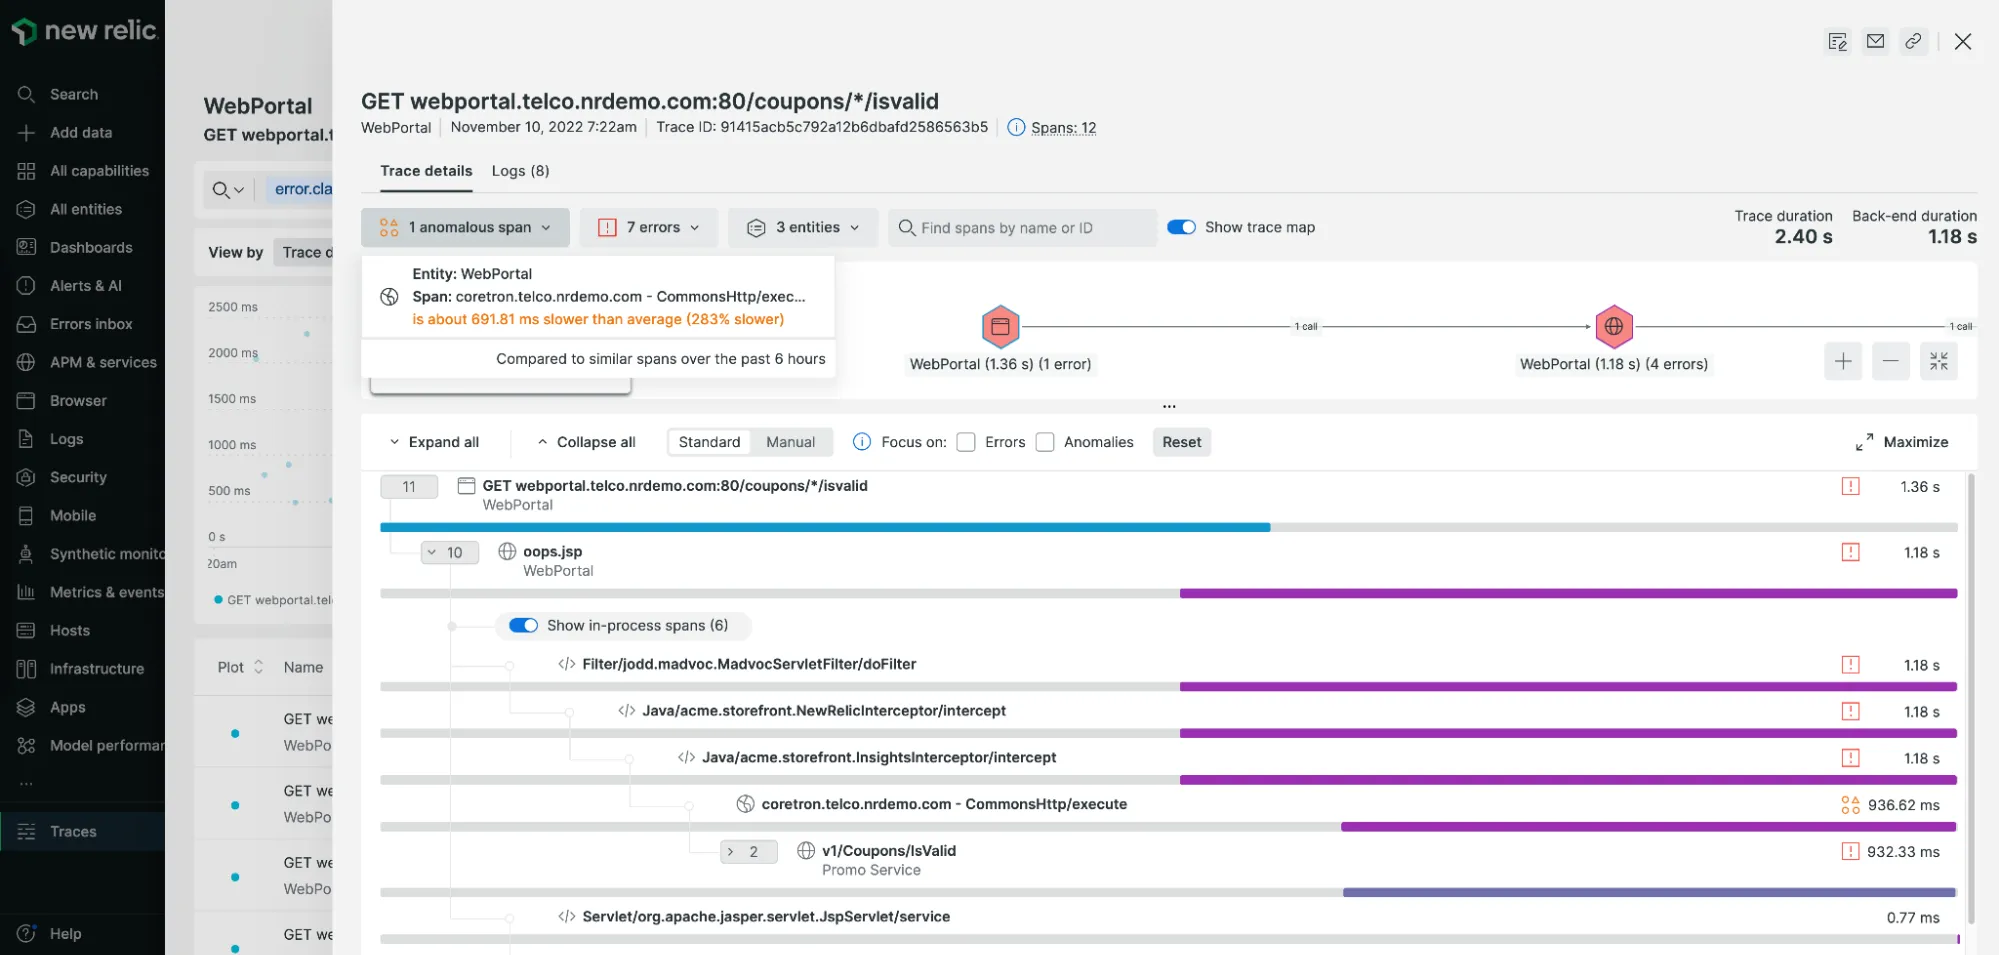
New Relic is one of the oldest companies in the application performance monitoring domain. It offers multiple solutions to enterprises for performance monitoring. For distributed tracing, it offers New Relic Edge, which can observe 100% of an application's traces.
Some of the key features of the New Relic distributed tracing tool includes:
- Distributed tracing and sampling options for a wide range of technology stack
- Support for open-source tracing tools and standards like OpenTelemetry
- Correlation of tracing data with other aspects of application infrastructure and user monitoring
- Fully managed cloud-native experience with on-demand scalability
Honeycomb
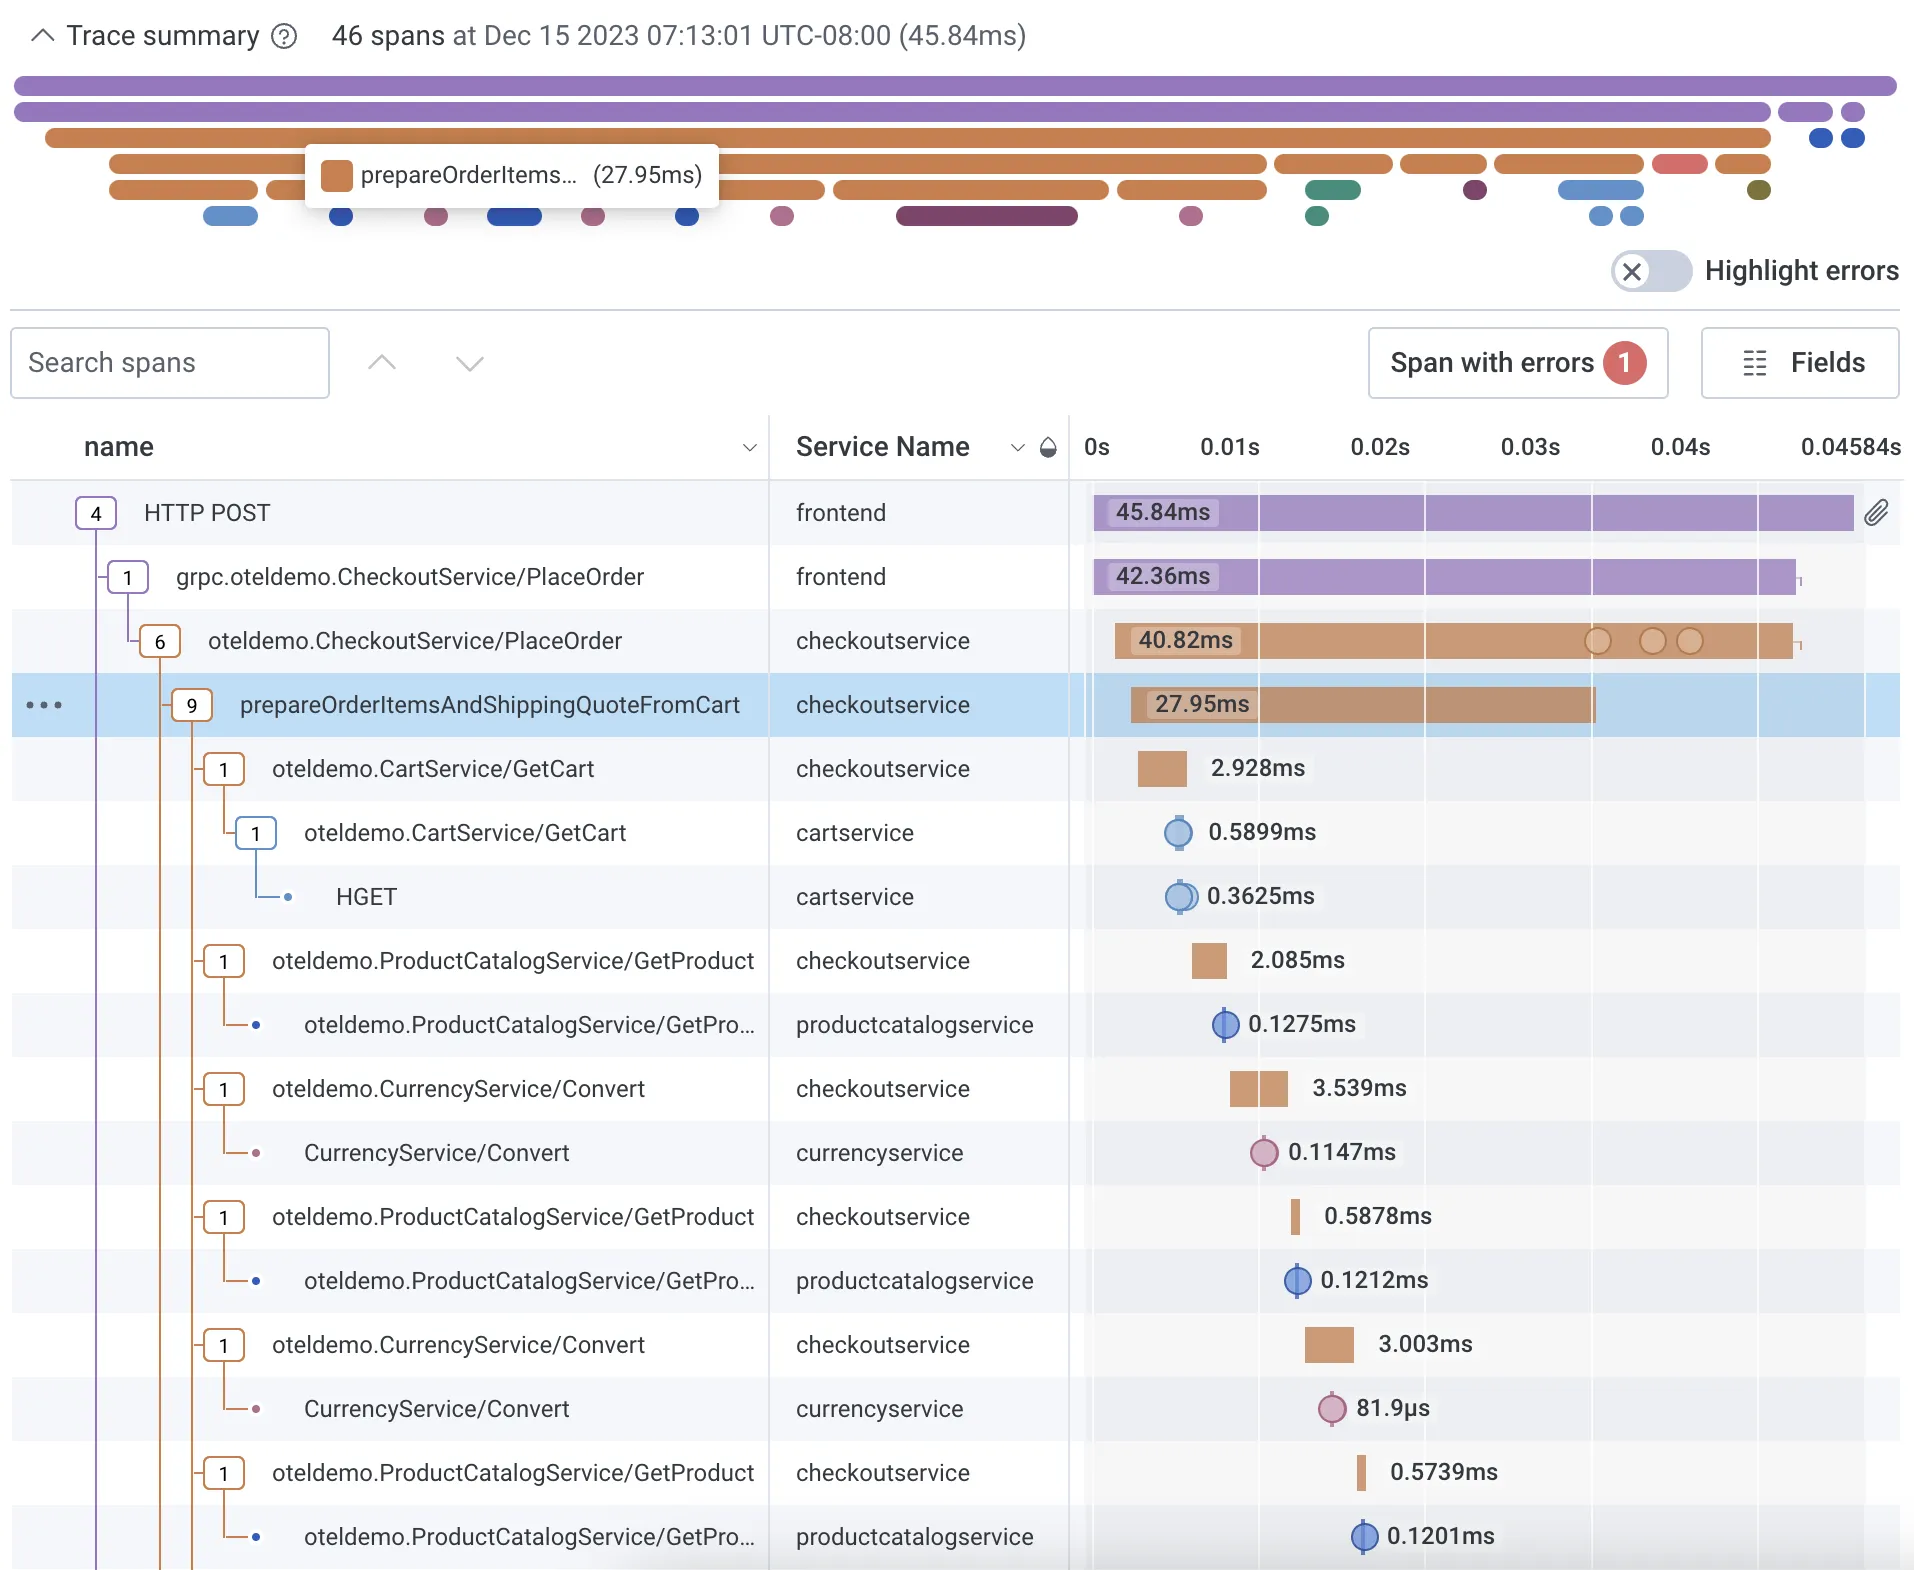
Honeycomb is a full-stack cloud-based observability tool with support for events, logs, and traces. Honeycomb provides an easy-to-use distributed tracing solution.
Some of the key features of the Honeycomb distributed tracing tool includes:
- Quickly diagnose bottlenecks and optimize performance with a waterfall view to understand how your system is processing service requests
- Full-text search over trace spans and toggle to collapse and expand sections of trace waterfalls
- Provides Honeycomb beelines to automatically define key pieces of trace data like serviceName, name, timestamp, duration, traceID, etc.
ServiceNow Cloud Observability
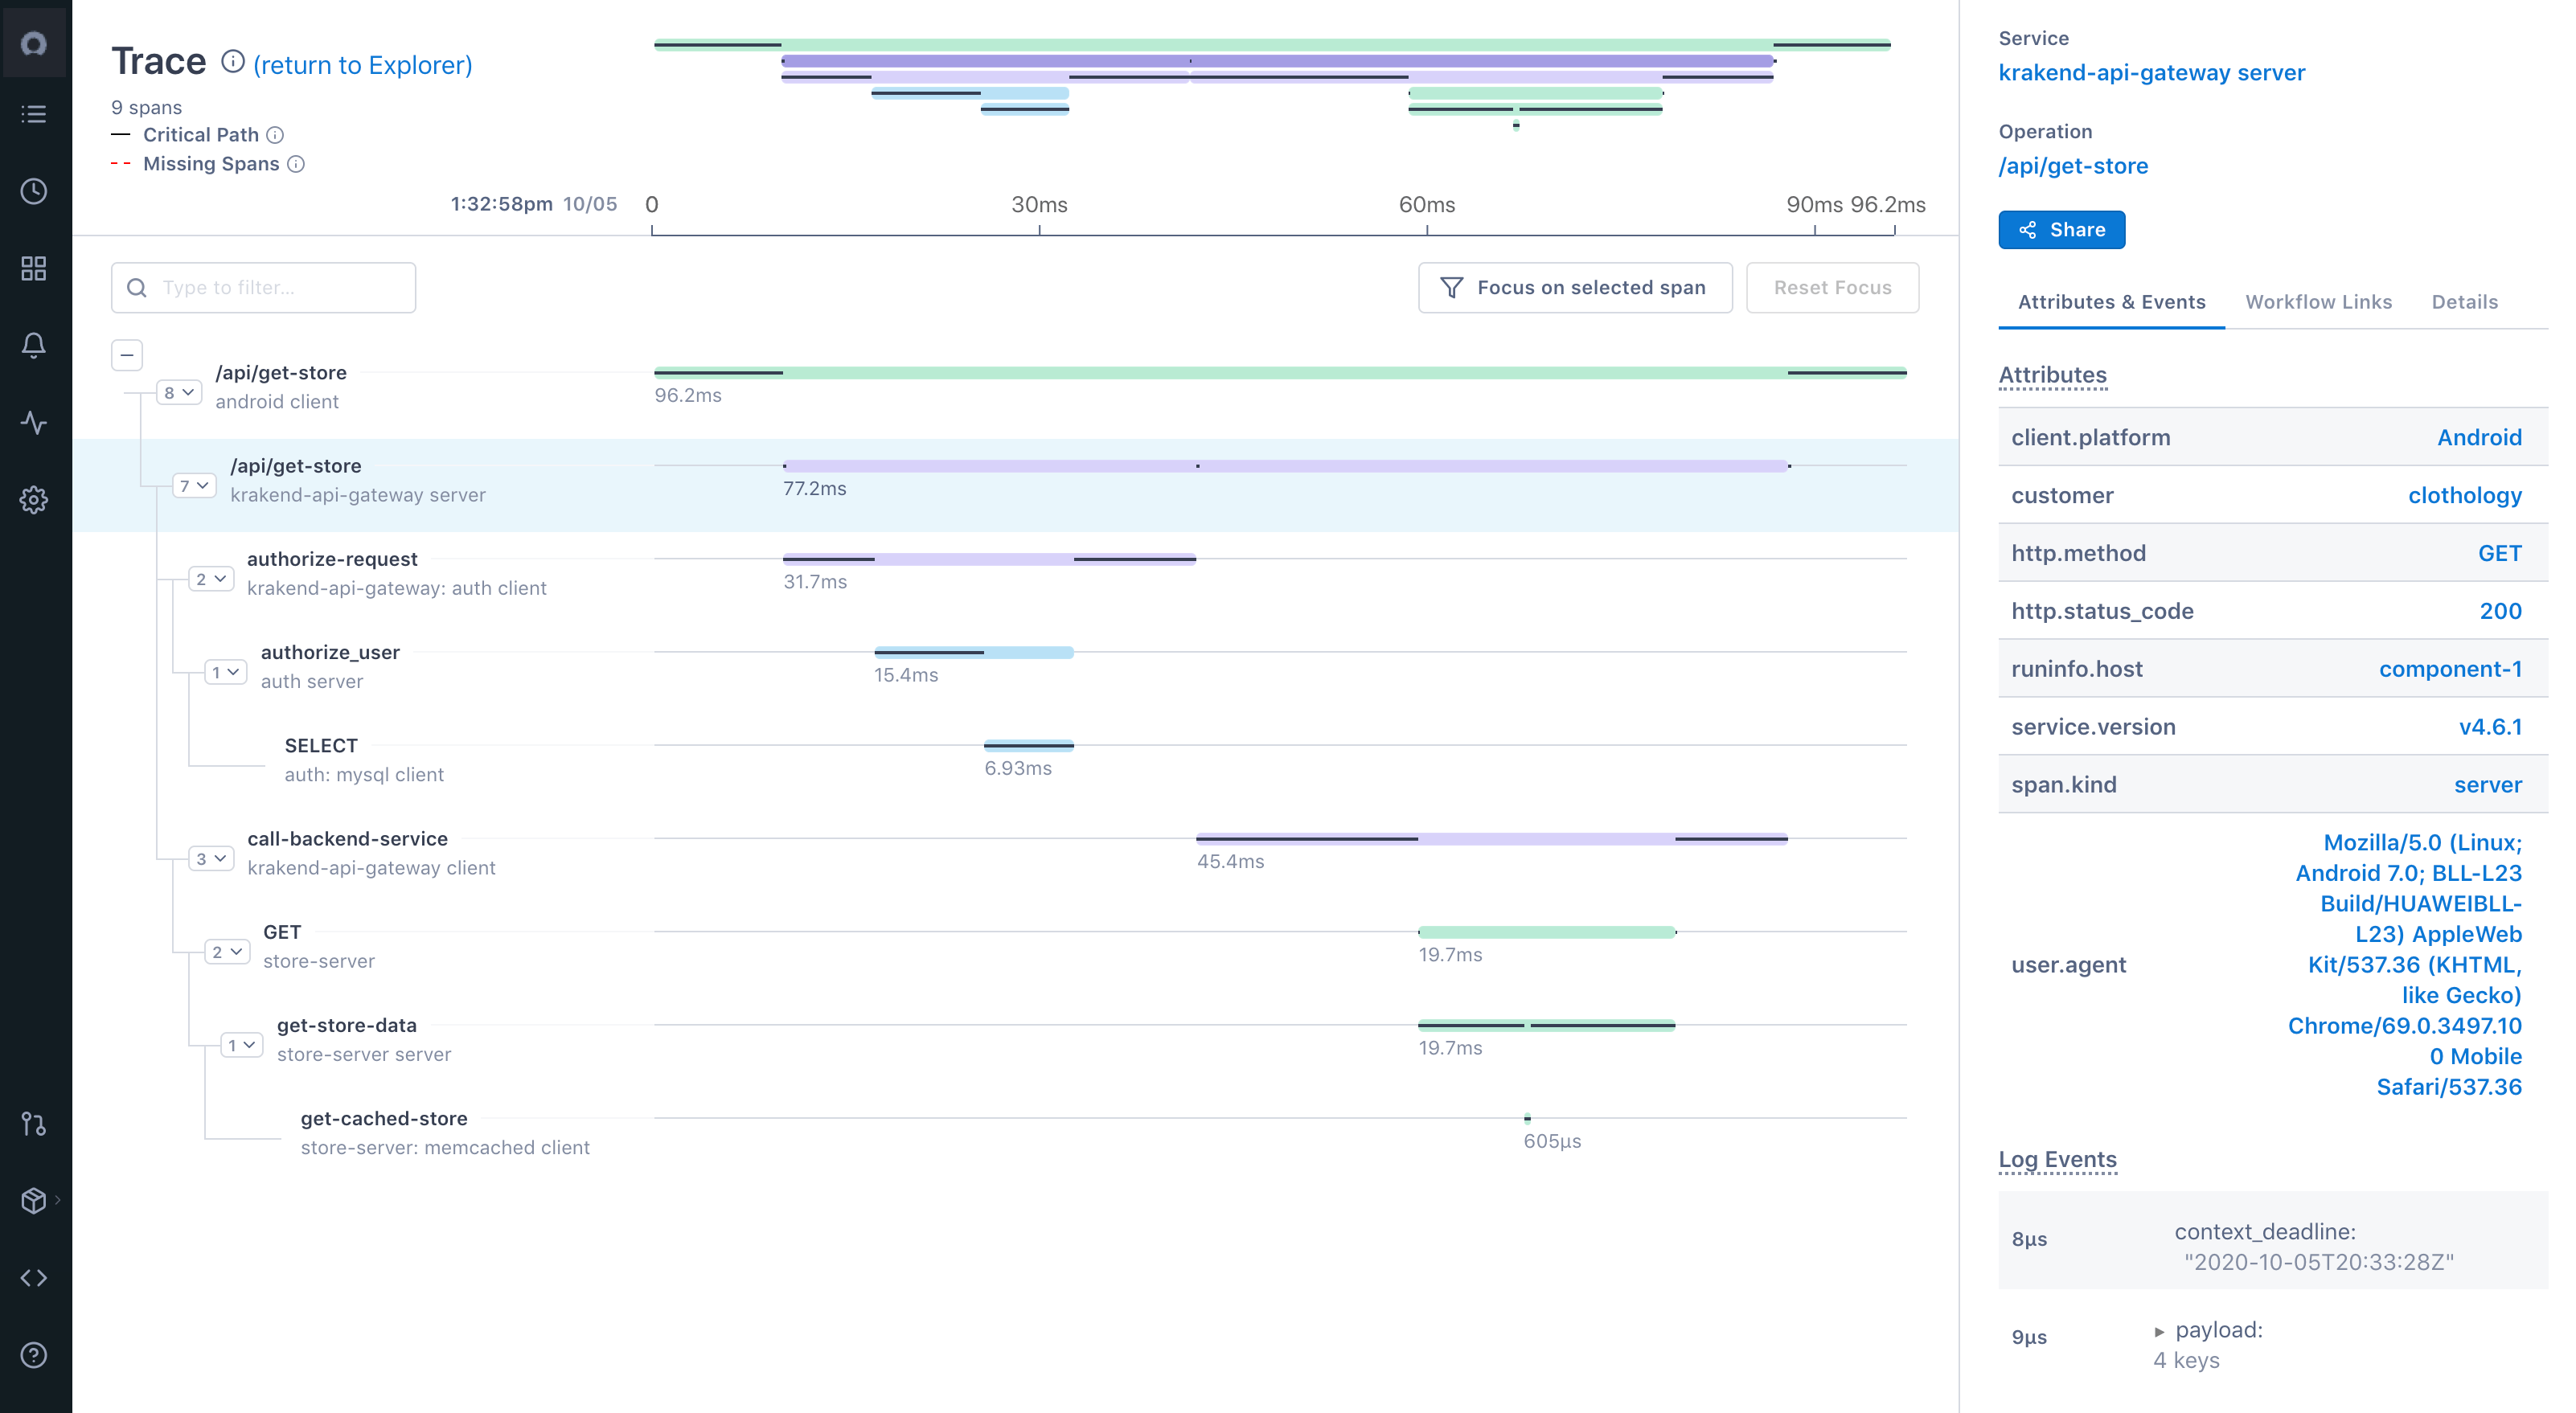
ServiceNow Cloud observability is a distributed tracing tool that provides complete visibility to distributed systems based on microservices and multi-cloud environment. It uses open-source friendly data ingestion methods and is built to support applications of any scale.
Some of the key features of the Lightstep distributed tracing tool includes:
- Move seamlessly from a high-level view of dependencies to specific services, operations, traces, or any other signals contributing to issues in production
- Provides full-context root cause analysis with exact logs, metrics, and traces to simplify and solve complex investigations
- Auto-instrumentation libraries powered by OpenTelemetry
Instana
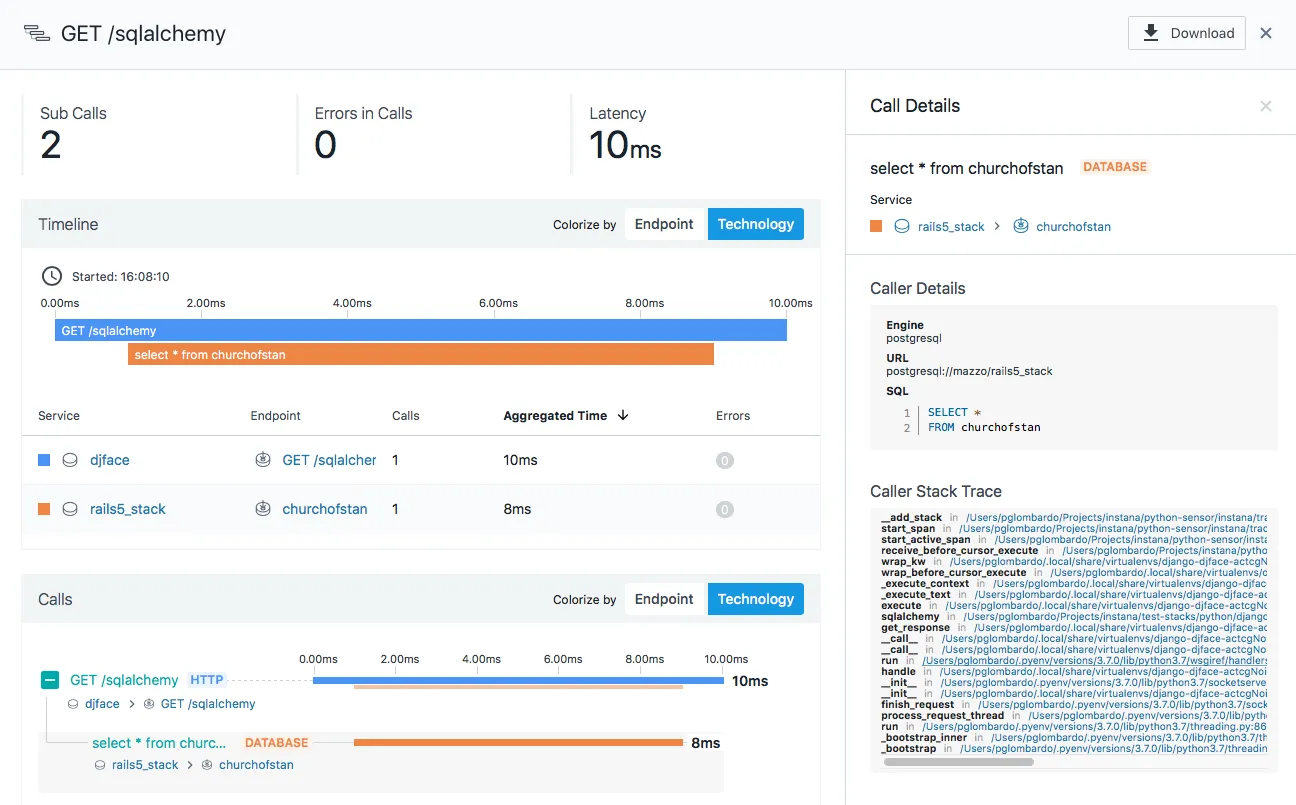
Instana is a distributed tracing tool aimed at microservice applications. The Instana platform offers website monitoring, cloud & infrastructure monitoring, observability platform apart from distributed tracing of microservice applications.
Some of the key features of the Instana distributed tracing tool includes:
- A single, lightweight agent per host to continually discover and monitor all components of the technology stack
- Dependency Map to continuously model application services and infrastructure
- Enriched trace data with information about the underlying service, application, and system infrastructure
- Root cause analysis with a correlated sequence of events and issues identifying the exact source of the problem
DataDog
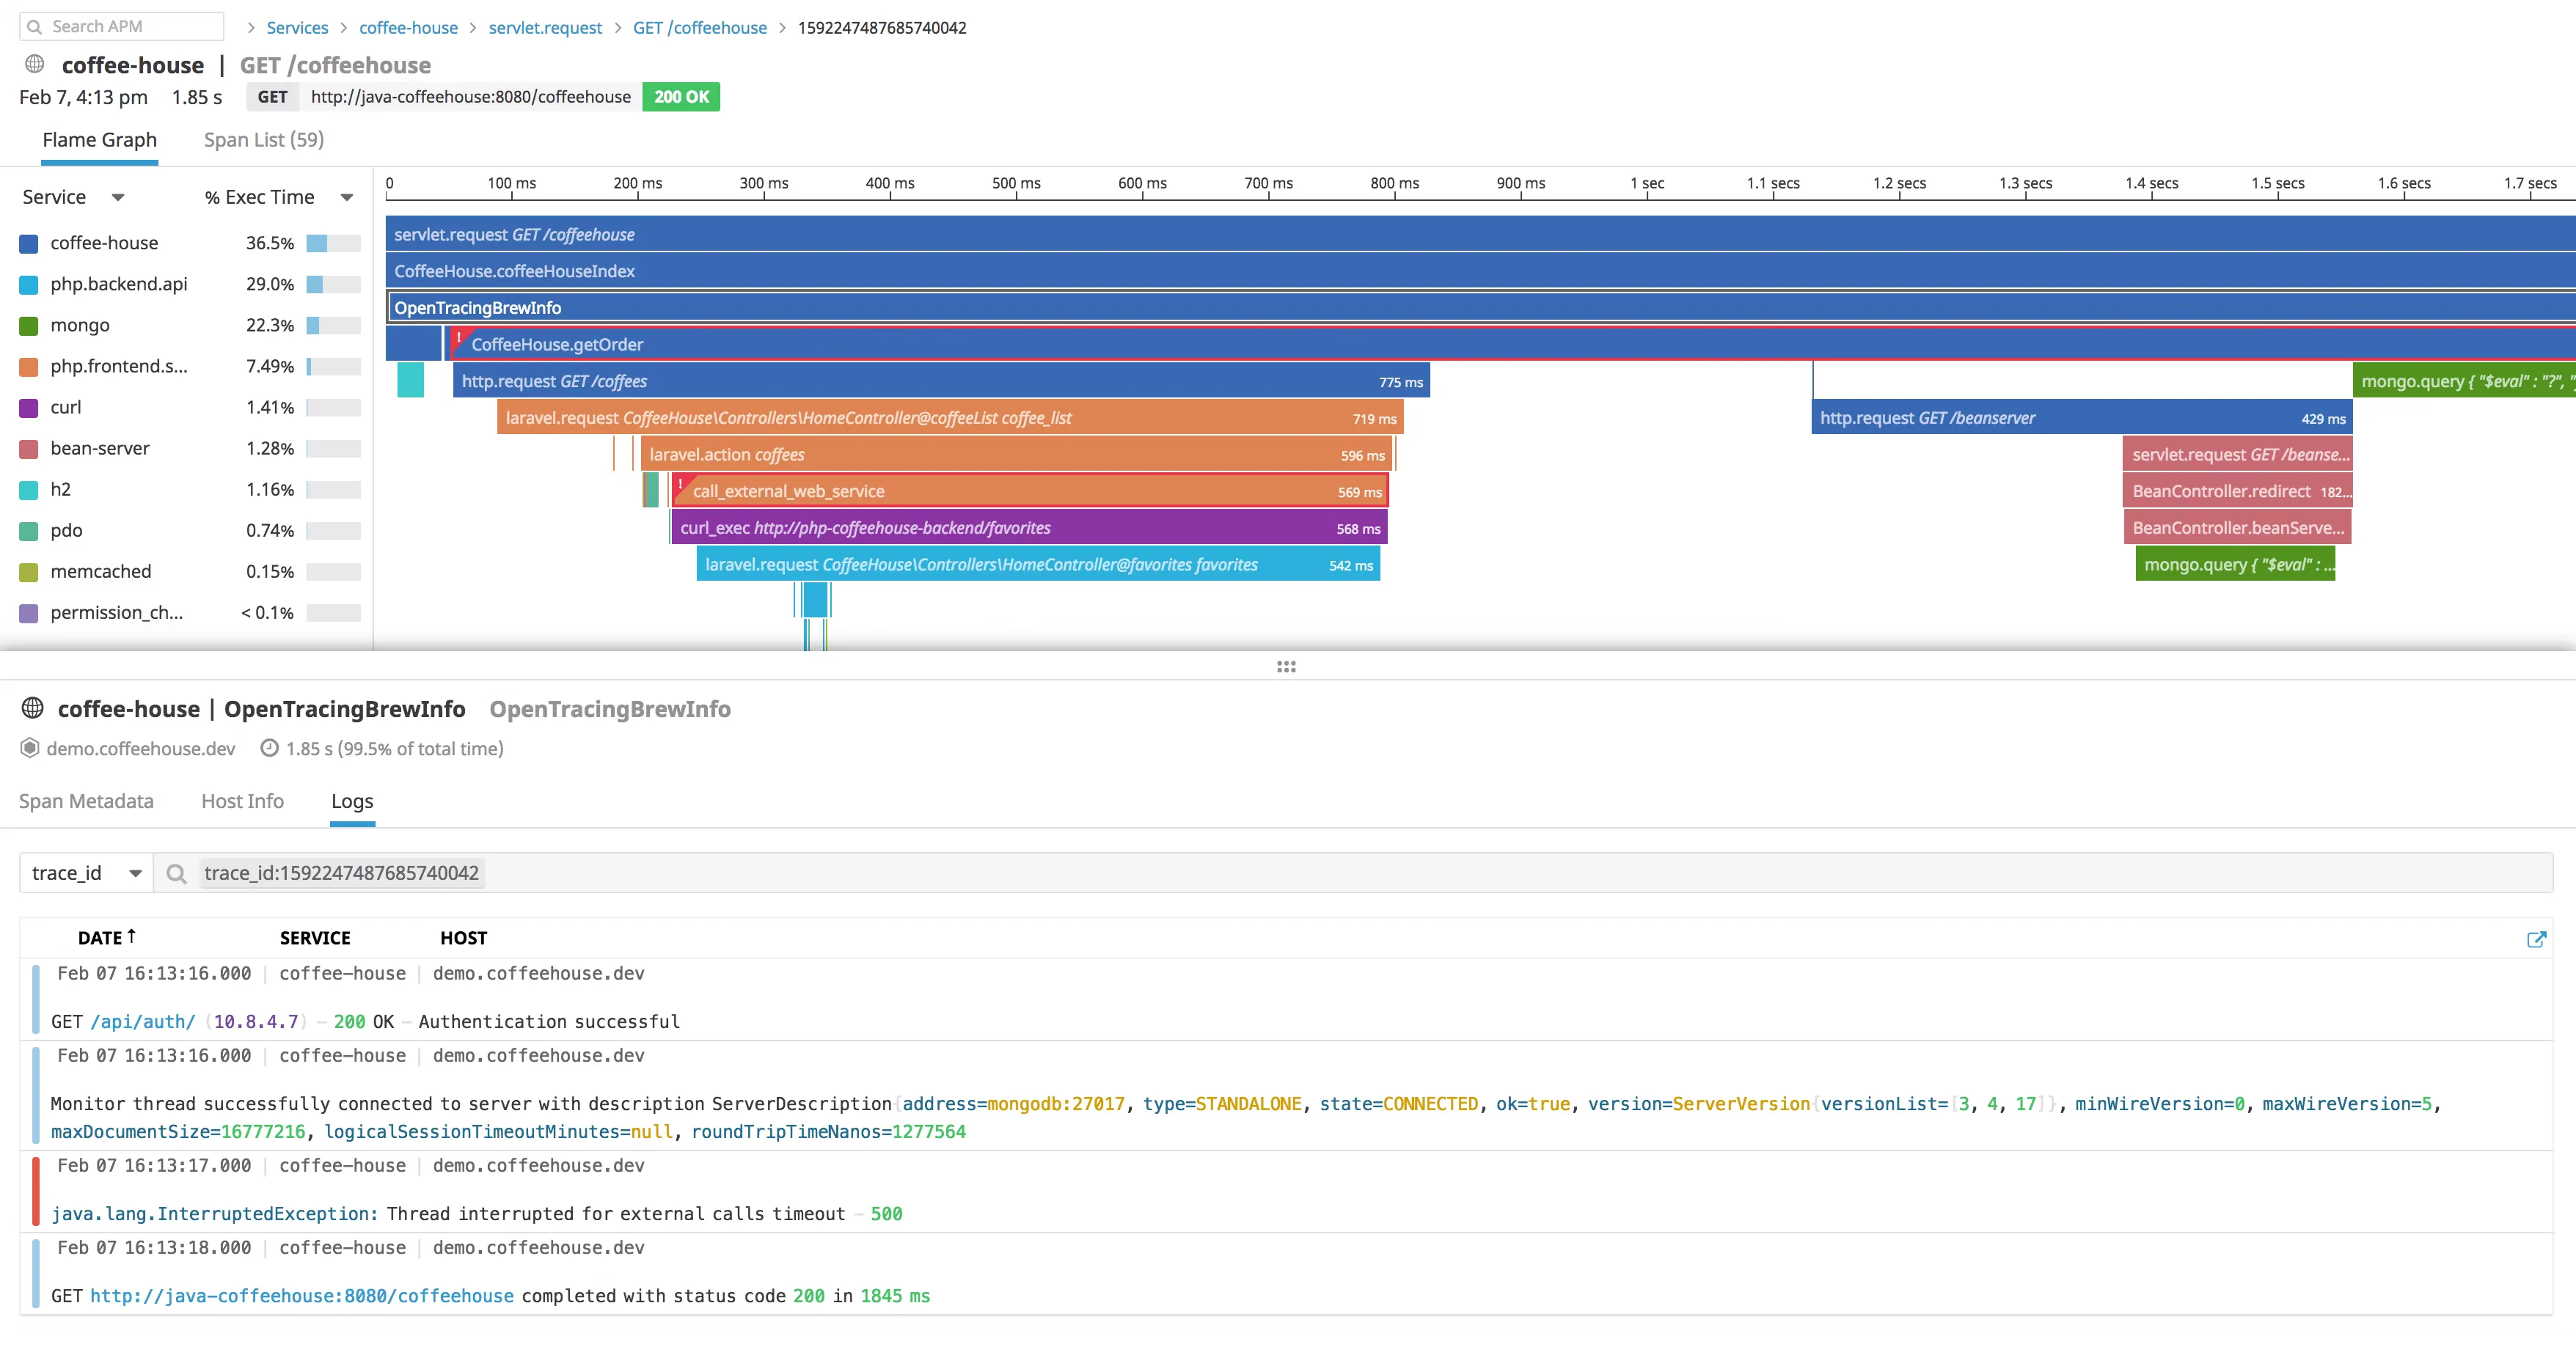
DataDog is an enterprise APM tool that provides monitoring products ranging from infrastructure monitoring, log management, network monitoring to security monitoring. Its application performance monitoring tool has distributed tracing capabilities.
Some of the key features of DataDog APM, which provides distributed tracing capabilities, includes:
- Out of box performance dashboards for web services, queues, and databases to monitor requests, errors, and latency
- Correlation of distributed tracing to browser sessions, logs, profiles, network, processes, and infrastructure metrics
- Can ingest 50 traces per second per APM host
- Service maps to understand service dependencies
Elastic APM
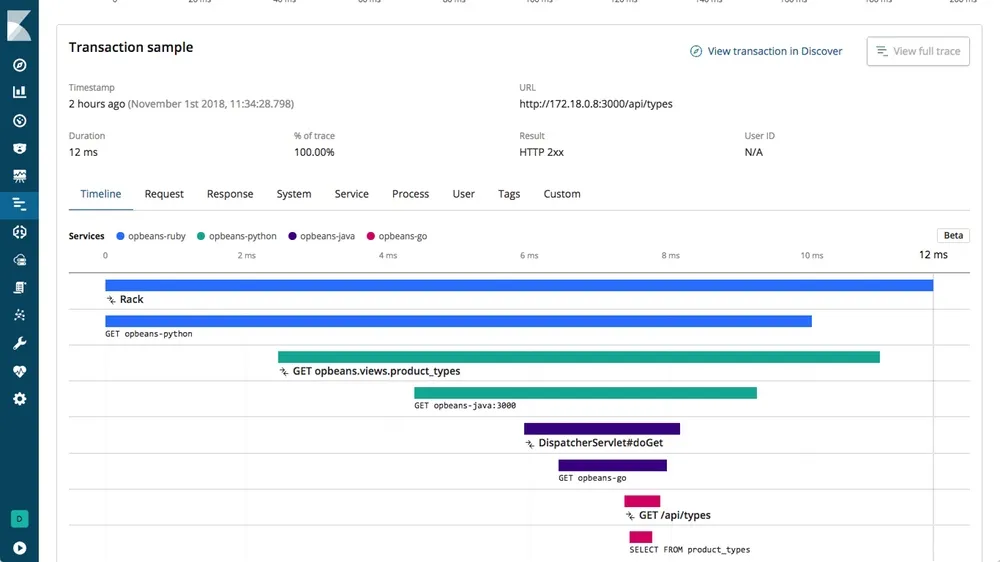
Elastic APM is an Application Performance Monitoring system built on the Elastic Stack - ElasticSearch, Logstash, and Kibana. It consists of four components:
- Elasticsearch - For data storage and indexing
- Kibana - For analyzing and visualizing the data
- APM agents - Collects the data to send to the APM server
- APM server - Receives data from APM agents and process it for storing in Elasticsearch
Splunk
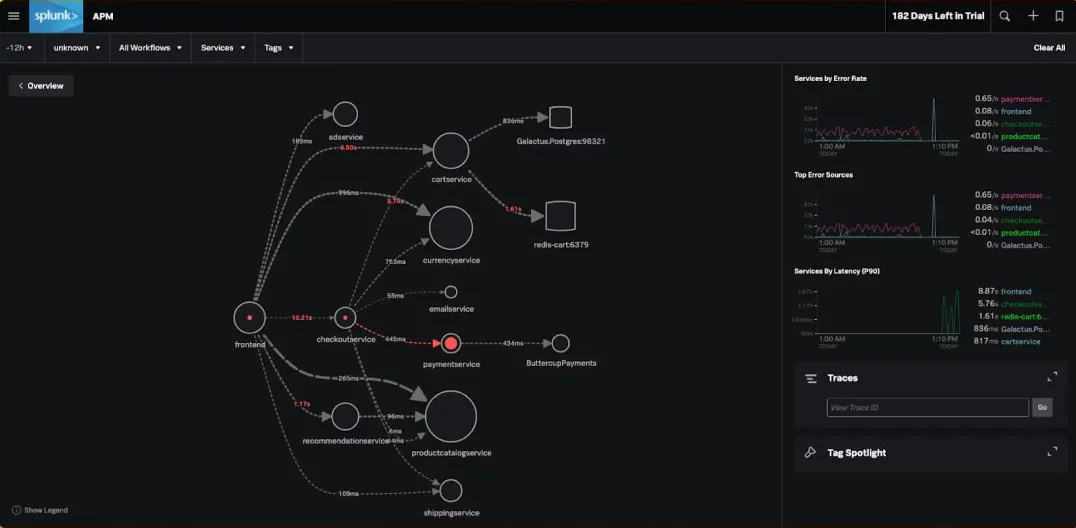
Splunk provides a distributed tracing tool that can ingest all application data for a high-fidelity analysis. It stores all trace data in Splunk Cloud's offering.
Some of the key features of the Splunk distributed tracing tool includes:
- No sample full fidelity trace data ingestion
With Splunk, you can capture all trace data to ensure your cloud-native application work the way it is supposed to. - Full-stack observability
Splunk APM provides a seamless correlation between infrastructure metrics and application performance metrics. - AI-Driven troubleshooting
Splunk APM provides uses an AI-driven approach to identify error-prone microservices.
AWS X-Ray
AWS X-Ray is a distributed tracing service designed for AWS-based applications:
- Integration with various AWS services
- Sampling rules for managing trace volume
- Service map visualization for understanding dependencies
- Insights into application performance and user behavior
X-Ray is the go-to choice for organizations heavily invested in the AWS ecosystem.
Google Cloud Trace
Google Cloud Trace is a managed distributed tracing service for applications running on Google Cloud Platform:
- Integration with Google Cloud's operations suite
- Automatic tracing for App Engine and Cloud Run
- Latency analysis and performance insights
- Seamless integration with other Google Cloud monitoring tools
Google Cloud Trace is best suited for teams building and running applications on Google Cloud Platform.
How to choose the right distributed tracing tool?
Tracing user requests is now critical for maintaining an exemplary user experience. Yes, distributed tracing directly impacts end-user experience as it gives your teams the right insights in the right amount of time to act on issues affecting application performance.
In our view, distributed tracing tools should be developer first tools. As developers directly utilize these tools in critical situations, the codebase of the tools should be open-source. Open-source is the future of all software tools.
Transparency and collaboration are some key benefits of open-source software tools. Developers want to see the code first hand, and if there are issues they want to address, they prefer to reach out to an active developer community than a customer support team.
At the same time, most open-source tools don't provide the same user experience as provided by SaaS vendors. But it doesn't have to be that way. With that objective, we created SigNoz.
SigNoz is a full-stack open-source application performance monitoring and observability tool. It provides a unified UI for both metrics and traces. Log management is also in the product roadmap and will be launched seen.
Setting Up SigNoz for Distributed Tracing
SigNoz provides a robust platform for distributed tracing that's easy to set up and use. Here's a brief overview of its capabilities:
- End-to-end distributed tracing with full context
- Service maps and dependency tracking
- Custom dashboard creation for tailored insights and alerting.
To get started with SigNoz, you have two options:
- SigNoz Cloud: A managed solution for easy setup and maintenance.
- Self-hosted: An open-source version for complete control and customization.
SigNoz cloud is the easiest way to run SigNoz. Sign up for a free account and get 30 days of unlimited access to all features.
You can also install and self-host SigNoz yourself since it is open-source. With 19,000+ GitHub stars, open-source SigNoz is loved by developers. Find the instructions to self-host SigNoz.
Best Practices for Implementing Distributed Tracing
To maximize the benefits of distributed tracing, follow these best practices:
- Standardize on OpenTelemetry: Use OpenTelemetry for instrumentation to ensure compatibility and future-proofing.
- Implement effective sampling strategies: Balance data volume and insight depth with intelligent sampling techniques.
- Correlate traces with logs and metrics: Combine different telemetry types for a complete observability picture.
- Establish clear naming conventions: Use consistent naming for spans and services to improve trace analysis.
- Instrument critical paths: Focus on instrumenting the most important workflows in your application first.
- Use context propagation: Ensure trace context is properly passed between services for accurate end-to-end tracing.
- Regularly review and optimize: Continuously analyze your tracing data to identify areas for improvement in your system.
Challenges in Distributed Tracing and How to Overcome Them
While distributed tracing offers significant benefits, it also comes with challenges:
- Managing data volume:
- Challenge: High-traffic systems can generate overwhelming amounts of trace data.
- Solution: Implement intelligent sampling strategies and use tools with efficient data storage and querying capabilities.
- Ensuring data privacy and security:
- Challenge: Trace data may contain sensitive information.
- Solution: Implement data masking, encryption, and access controls in your tracing pipeline.
- Consistent instrumentation across polyglot environments:
- Challenge: Different services may use different languages and frameworks.
- Solution: Adopt OpenTelemetry to provide a consistent instrumentation approach across various technologies.
- Correlating traces across complex architectures:
- Challenge: Microservices can have intricate dependencies and communication patterns.
- Solution: Use tools with advanced correlation features and service maps to visualize and understand complex interactions.
- Minimizing performance overhead:
- Challenge: Tracing can introduce latency to your applications.
- Solution: Choose lightweight instrumentation libraries and use sampling to reduce the impact on performance.
By addressing these challenges proactively, you can implement a robust distributed tracing strategy that provides valuable insights without compromising your system's performance or security.
Key Takeaways
- Distributed tracing is essential for understanding and optimizing microservices architectures.
- OpenTelemetry is becoming the standard for instrumentation, offering consistency across different tools and environments.
- A mix of open-source and commercial tools are available to suit different needs and budgets.
- Effective implementation requires careful planning, best practices, and ongoing optimization.
- Challenges such as data volume and privacy can be overcome with proper strategies and tool selection.
FAQs
What is the difference between distributed tracing and logging?
Distributed tracing focuses on tracking requests across multiple services, providing a holistic view of system interactions. Logging, on the other hand, captures discrete events within individual components. While both are valuable, tracing offers a more comprehensive picture of request flow and performance across a distributed system.
How does distributed tracing impact application performance?
When implemented correctly, the performance impact of distributed tracing is minimal. Modern tracing libraries are designed to be lightweight, and sampling techniques can further reduce overhead. The insights gained from tracing often lead to performance improvements that far outweigh any minor overhead introduced.
Can distributed tracing work in serverless environments?
Yes, distributed tracing can be implemented in serverless environments. Many tracing tools offer specific integrations for serverless platforms like AWS Lambda or Google Cloud Functions. However, the ephemeral nature of serverless functions can present unique challenges, such as maintaining trace context across invocations.
What are the key considerations when choosing a distributed tracing tool?
When selecting a distributed tracing tool, consider:
- Compatibility with your technology stack
- Ease of implementation and maintenance
- Scalability to handle your data volume
- Integration with your existing monitoring tools
- Cost and licensing model
- Data retention and storage options
- Analysis and visualization capabilities
- Support for OpenTelemetry standards
Evaluate these factors against your specific needs and constraints to choose the most suitable tool for your organization.
What is distributed tracing and why is it important for microservices?
Distributed tracing is a method of tracking and analyzing requests as they flow through distributed systems. It's crucial for microservices because it provides end-to-end visibility, helps in performance optimization, simplifies debugging in complex systems, reveals service dependencies, and aids in root cause analysis.
What are the key features to look for in distributed tracing tools?
Key features include end-to-end visibility, language and framework support, integration capabilities, scalability, data visualization, sampling techniques, and OpenTelemetry support.
How does distributed tracing differ from logging?
While logging captures discrete events within individual components, distributed tracing focuses on tracking requests across multiple services, providing a holistic view of system interactions and performance across a distributed system.
What impact does distributed tracing have on application performance?
When implemented correctly, the performance impact of distributed tracing is minimal. Modern tracing libraries are designed to be lightweight, and sampling techniques can further reduce overhead. The insights gained often lead to performance improvements that outweigh any minor overhead.
Can distributed tracing be implemented in serverless environments?
Yes, distributed tracing can be implemented in serverless environments. Many tracing tools offer specific integrations for serverless platforms like AWS Lambda or Google Cloud Functions. However, the ephemeral nature of serverless functions can present unique challenges, such as maintaining trace context across invocations.
What are the main challenges in implementing distributed tracing?
The main challenges include managing data volume, ensuring data privacy and security, achieving consistent instrumentation across polyglot environments, correlating traces across complex architectures, and minimizing performance overhead.
How do you choose the right distributed tracing tool?
When selecting a distributed tracing tool, consider factors such as compatibility with your technology stack, ease of implementation and maintenance, scalability, integration with existing monitoring tools, cost and licensing model, data retention and storage options, analysis and visualization capabilities, and support for OpenTelemetry standards.
Related Content


