ELK is the acronym Elasticsearch, Logstash, and Kibana, and combined, it is one of the most popular log analytics tools. Elastic changed the license of Elasticsearch and Kibana from the fully open Apache 2 license to a proprietary dual license. The ELK stack is also hard to manage at scale. SigNoz can be used as a lightweight alternative to the ELK stack.

Log complexity has increased in modern applications
Because of cloud computing and containerization, modern applications have become distributed and complex. These software systems generate an enormous amount of log data. Application owners use logs for critical information and use them to understand their applications better. Log management is a mandatory and crucial component of modern DevOps.
Microservices, containers, serverless, open source frameworks and components have changed the way software is developed today. While solving the need for on-demand scaling to meet growing customer demands, these technologies have also increased the operation complexity manifolds. It has also made logging pipelines very complex, with the need for a robust log management solution.
Running an ELK stack is not easy
ELK stack comprises of following four independent components:
Elasticsearch
A search and analytics engine.Logstash
A data ingestion and processing pipeline.Kibana
A user interface to visualize Elasticsearch data.Filebeat
Agents to collect data from applications and servers.
In order to run an ELK stack, you need to use a combination of these four components. You can run a free and open version of these components to build a log management solution. But it’s not easy.
ELK stack is not a one-time setup solution. Once you deploy it, you must invest resources in operating and maintaining a production-grade ELK stack.
The cost of running an ELK stack can be divided into four main categories:
- Hosting/infrastructure,
- Operations,
- Customizations, and
- Support
The infrastructure cost depends on your logging requirements. Running an ELK stack at scale requires a lot of resources. Operations and customizations require allocating full-time engineering bandwidth. Support involves training employees to use the ELK stack effectively, and there is a cost associated with it. If you are ingesting log data at scale, the ELK stack might prove inefficient. Even after using enough resources, the ELK stack might be slow.
Users who have faced difficulty running and maintaining an ELK stack often start looking for a lightweight alternative. A log management solution should be easy to deploy, easy to use, and easy to manage at scale. SigNoz - an open source full-stack APM supports log management and can be a great open source alternative for ELK.
Key Features of SigNoz - a lightweight open source ELK alternative
SigNoz is full-stack open source Application Performance Monitoring tool that you can use for monitoring logs, metrics, and traces. Having all the important telemetry signals under a single dashboard leads to less operational overhead. Users can also access telemetry data with richer context by correlating these signals.
Let us look at some of the key features of SigNoz.
Uses resource-efficient columnar database
SigNoz uses a columnar database - ClickHouse, for storing logs efficiently. Big companies like Uber and Cloudflare have shifted from Elasticsearch to ClickHouse for storing their log data.
An OpenTelemetry native APM
SigNoz is built to support OpenTelemetry natively. OpenTelemetry is quietly becoming the world standard for instrumenting cloud-native applications. OpenTelemetry provides a vendor-agnostic instrumentation layer for all important telemetry signals, including logs, metrics, and traces.
OpenTelemetry logs support legacy logging libraries while aiming to integrate logs more strongly with other telemetry signals.
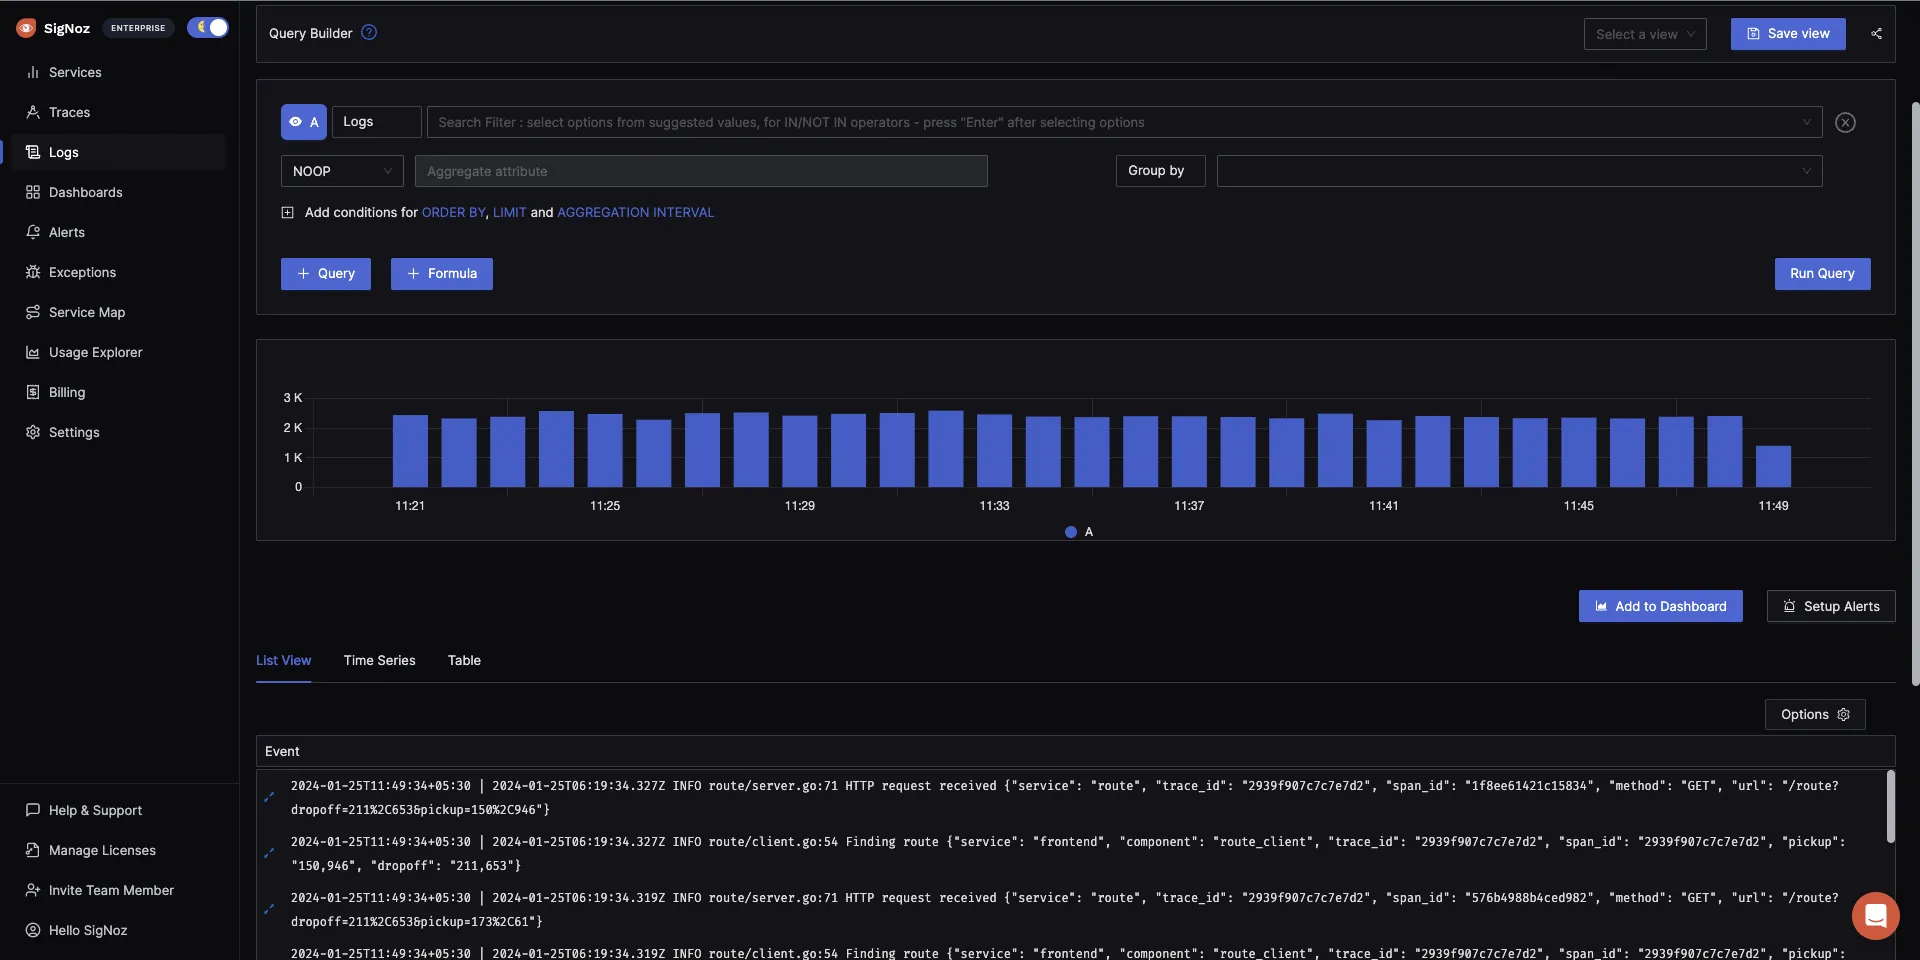
Out-of-box intuitive UI for Logs management
SigNoz provides an intuitive UI to see your logs data with the ability to see logs volume, logs data, and important fields at a glance.

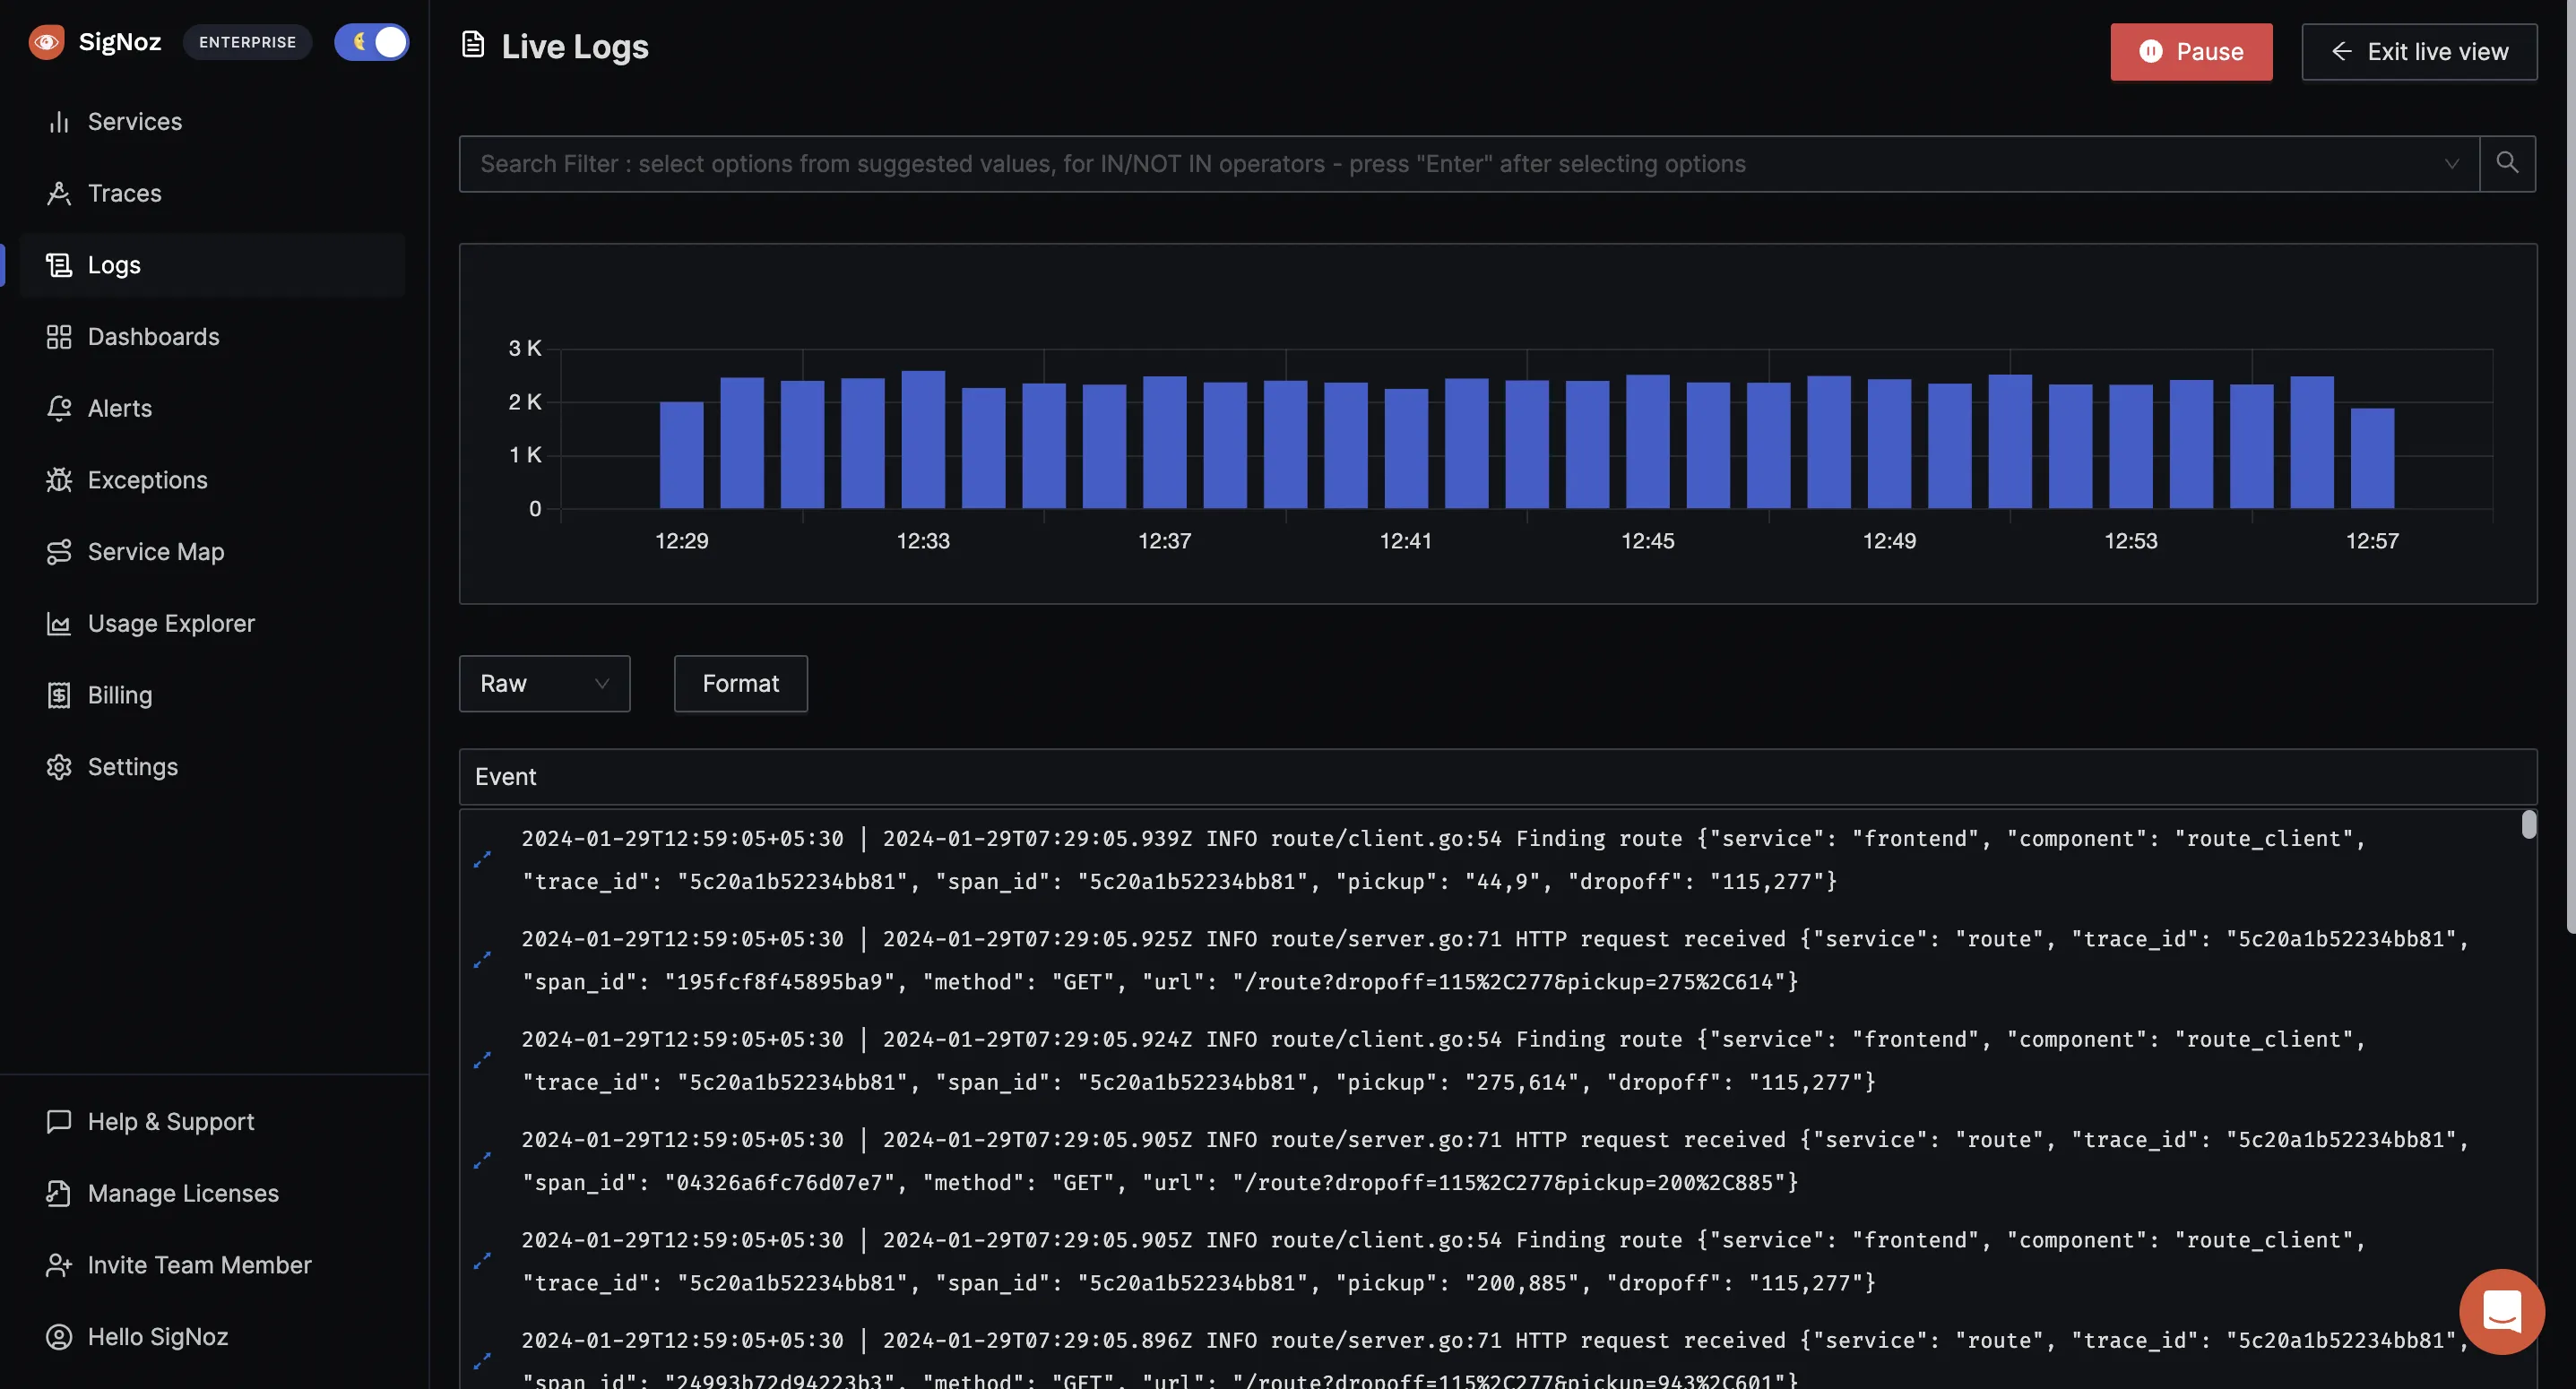
Live Tail Logging
You can also view logs in real-time with live tail logging.

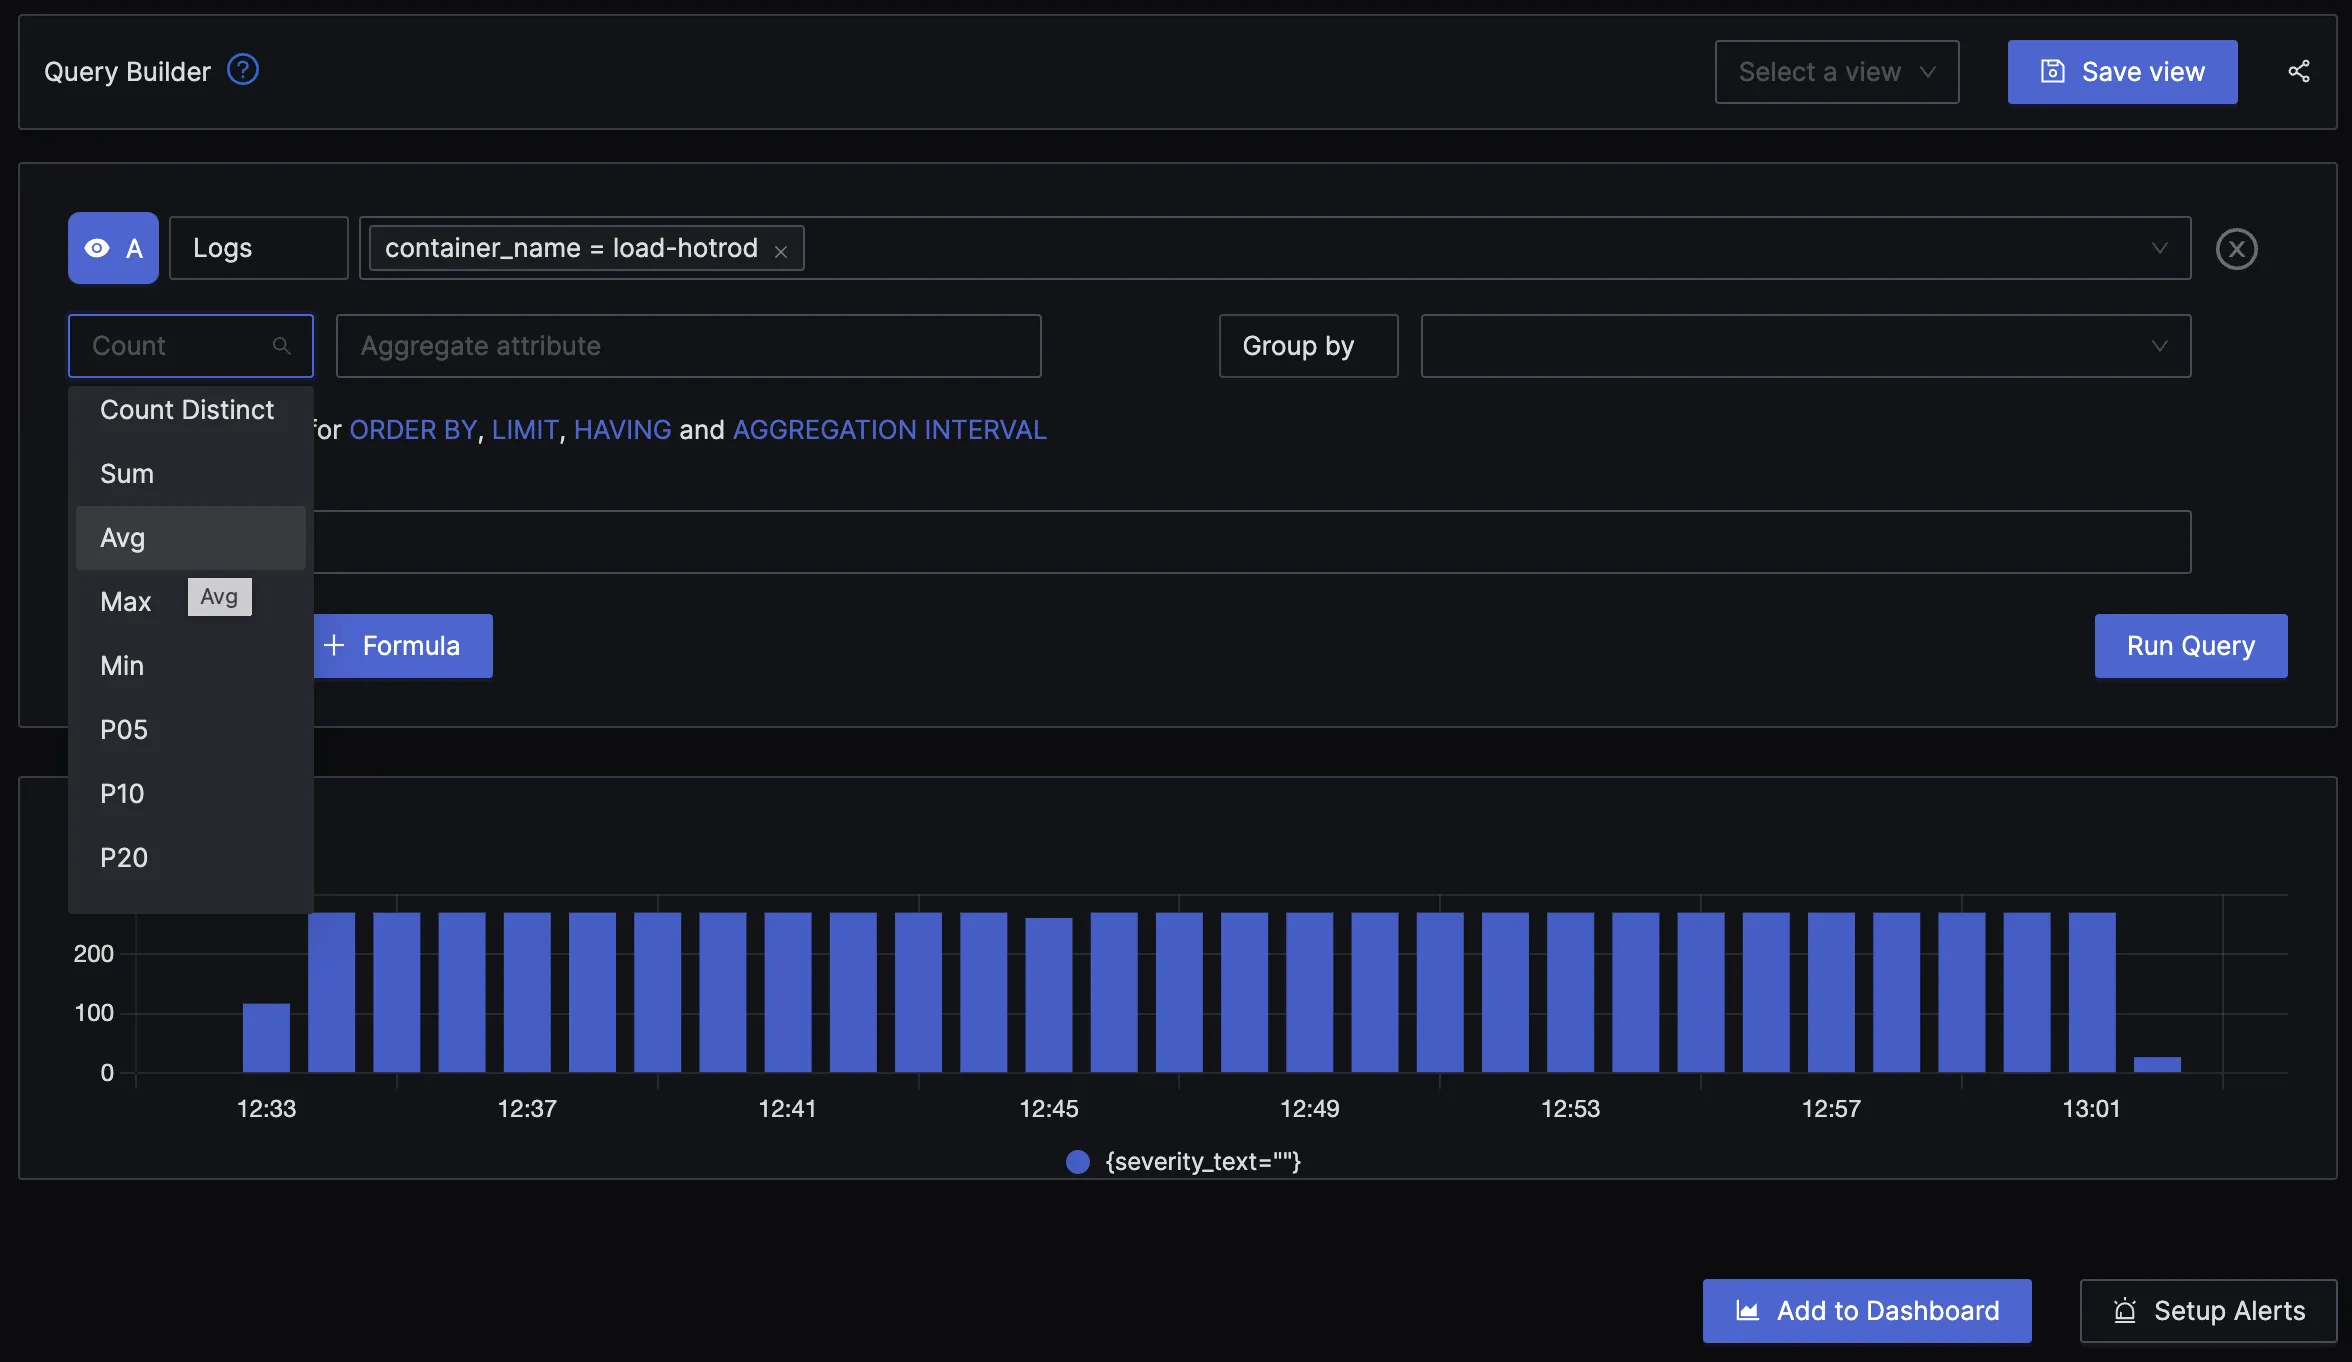
Advanced Logs Query Builder
Log data is often vast, and developers need to check and see the logs they are interested in quickly. With an advanced Log Query Builder, you can filter out logs quickly with a mix-and-match of fields.

Correlating Logs with other Observability signals
As SigNoz uses OpenTelemetry to collect and parse logs, you can use it to correlate logs with other observability signals like traces and metrics. Correlating logs with other observability signals can enrich your logs data and help debug applications faster.
Seamless transition from your existing logging pipelines
Shifting your logs pipeline to SigNoz is easy and simple. If you are using FluentBit, FluentD, or Logstash to collect logs, you can easily shift your logs pipeline to SigNoz. Check out the instructions here.
Getting started with SigNoz
SigNoz cloud is the easiest way to run SigNoz. Sign up for a free account and get 30 days of unlimited access to all features.
You can also install and self-host SigNoz yourself since it is open-source. With 19,000+ GitHub stars, open-source SigNoz is loved by developers. Find the instructions to self-host SigNoz.
Related Content
OpenTelemetry Logs - A Complete Introduction & Implementation
An Open Source OpenTelemetry APM


