It is day 3 of SigNoz Launch Week 2.0, and we’re super excited to unveil features related to one of the core tenets of SigNoz. With SigNoz, you can monitor logs, metrics, and traces under a single pane of glass.
With three signals under a single pane of glass, the scope for getting more context while debugging your application is immense. Using SigNoz, you can already correlate your traces with logs and check traces associated with APM metrics. We’re excited to announce new features focused on the correlation of signals.
We've enhanced the ability to link infrastructure metrics with logs and logs with APM metrics, helping you resolve issues more efficiently. Let’s explore what these features bring and how they can transform your troubleshooting process.
Why Correlation Matters
SigNoz is designed to provide a unified view of metrics, traces, and logs, allowing you to navigate seamlessly across different signals. Correlating data is crucial for debugging. For instance, you might observe a spike in latency in your APM metrics and want to check relevant traces, logs, or infra metrics to pinpoint the cause. Having correlated signals improves the speed of resolving issues, and during critical times like downtime, it can save you precious time before customers lose trust in your product.
Introducing Logs with Associated Infra Metrics
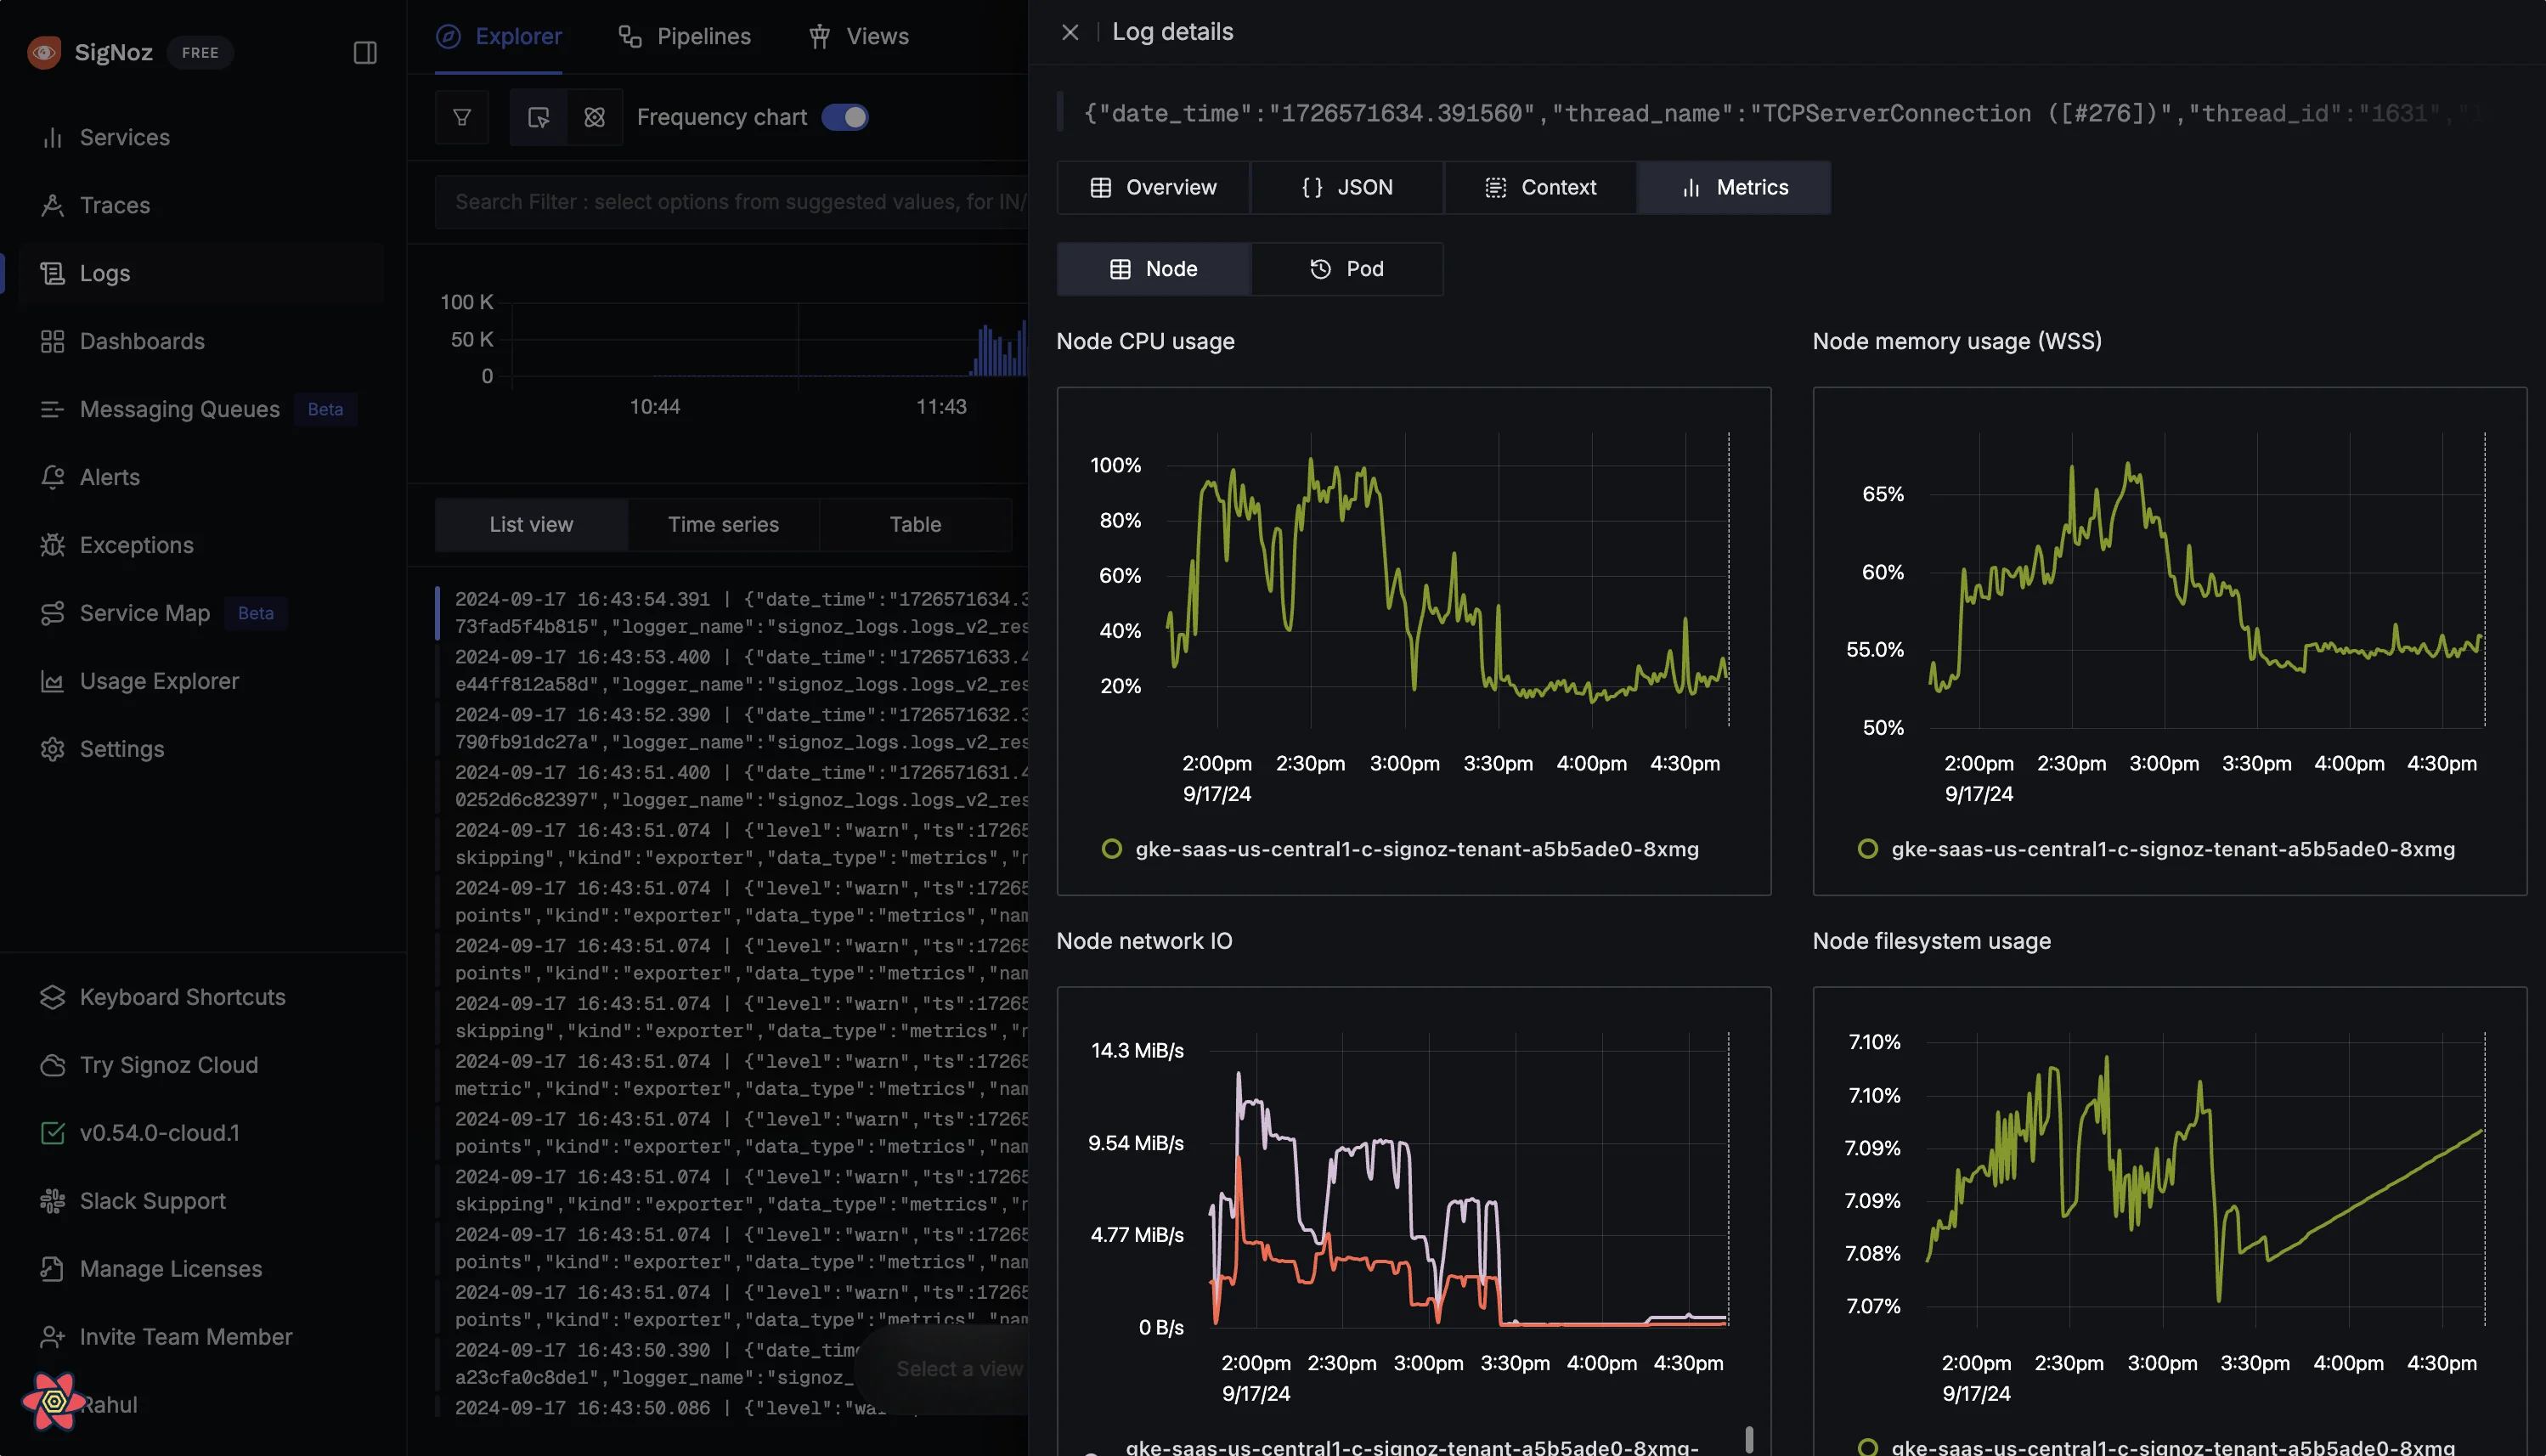
When applications run on platforms like Kubernetes, there are numerous components and metrics to monitor. Developers often need to determine if an error in the logs relates to infrastructure issues, like resource constraints. The correlation of signals allows you to view infra metrics (CPU, memory usage) directly from the logs.
Introducing Navigation from APM Latency Charts to Logs
Until now, you could navigate from APM latency charts to traces.
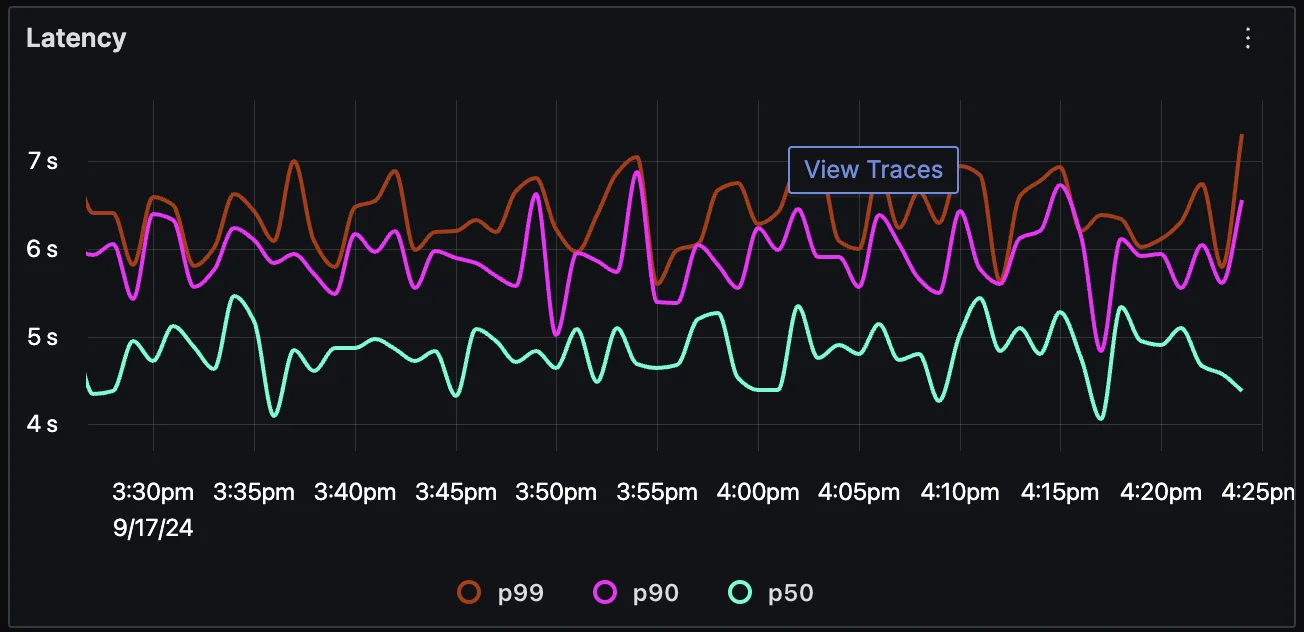
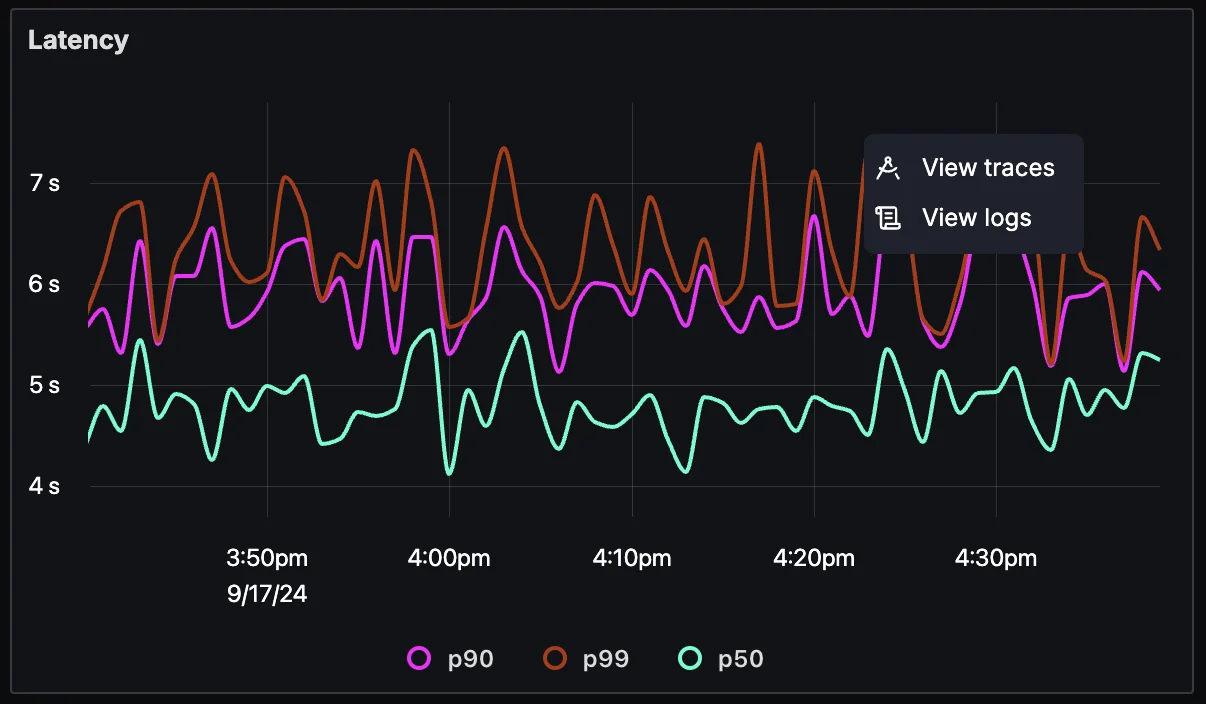
With this new update, you can also jump from latency charts directly to logs for a selected time period. For example, if you notice a spike in latency:
- Click on the spike in the latency chart.
- Use the new View Logs button to navigate to the log explorer, where relevant logs for the selected time period and service are automatically filtered.
This helps you identify any specific log entries that might explain the latency, such as errors or warnings that indicate issues within the application.
How it works
Here’s a quick demo of how these features work in SigNoz:
Logs to Kubernetes Infra Metrics
Now, you can directly view infra metrics from a log entry. When you click on a log line, you will see:
Pod Metrics: CPU and memory usage of the Kubernetes pod that emitted the log. This includes a comparison of actual usage against the requested resources and limits, helping you identify if resource constraints might have contributed to an error.
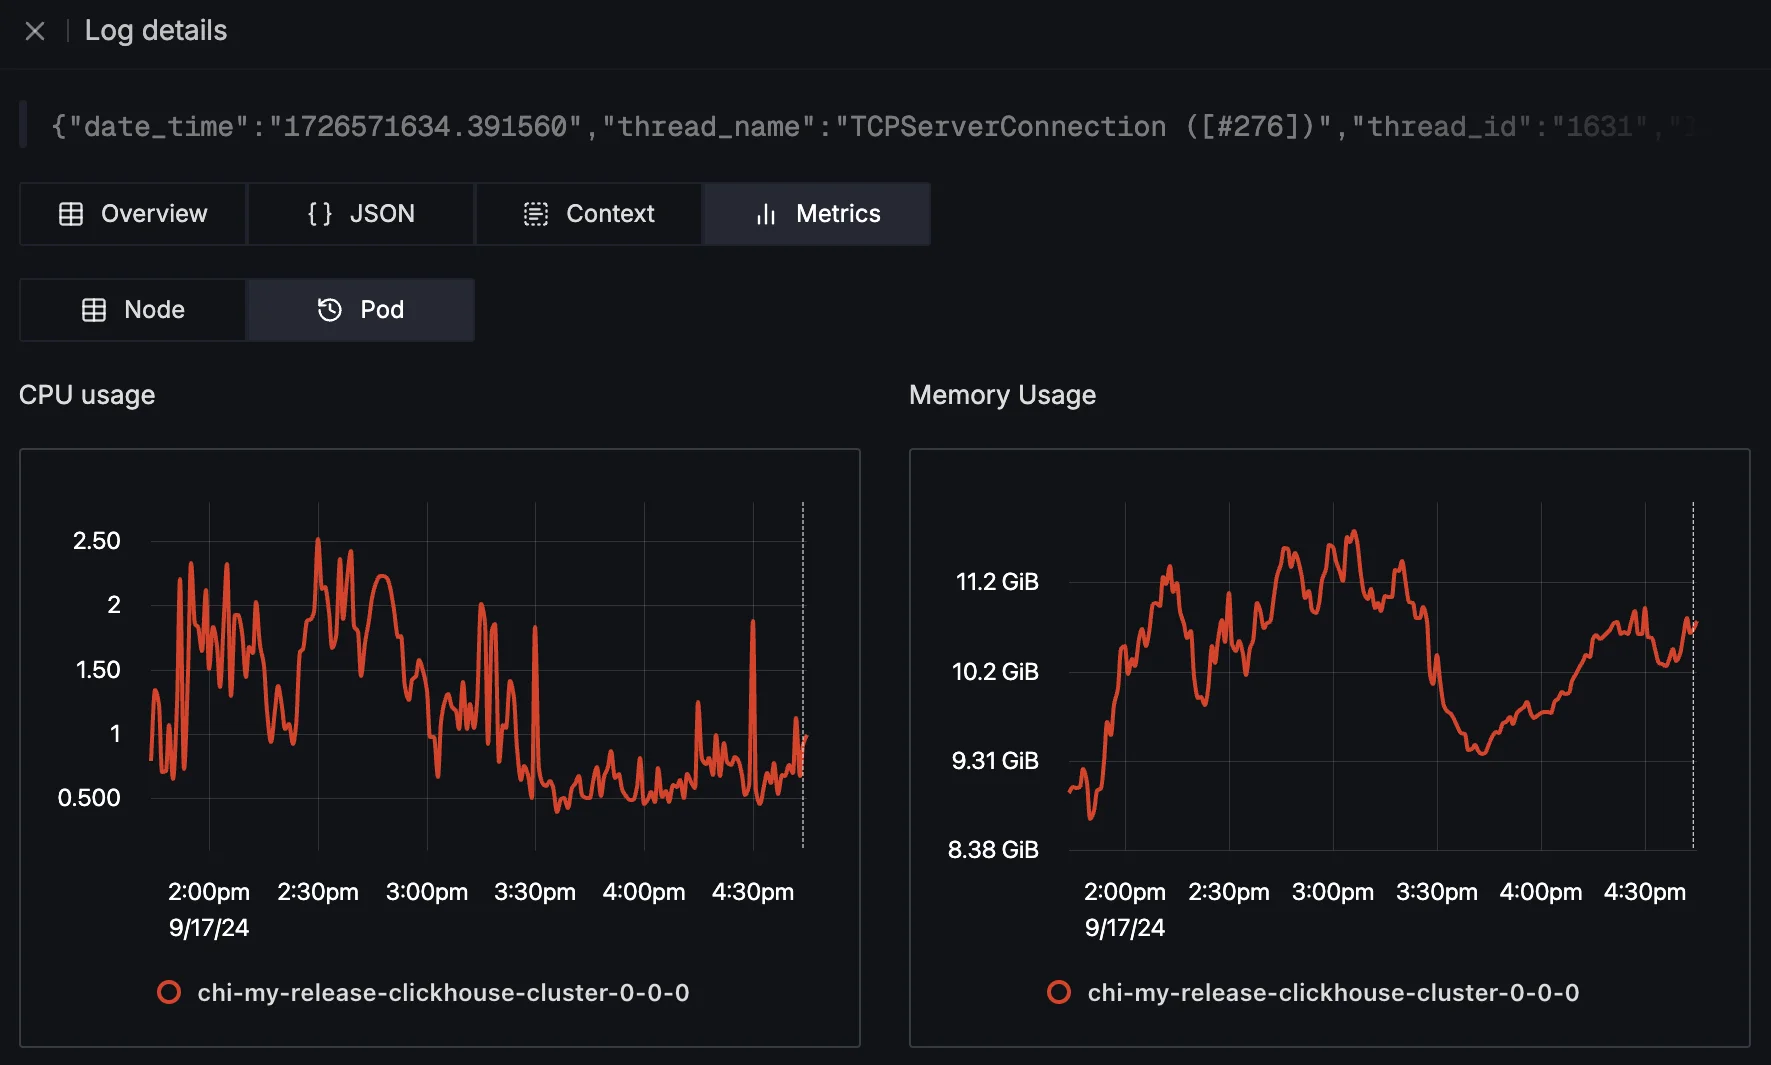
Check Pod Metrics associated with the log from a particular K8s pod Node Metrics: Total CPU and memory usage of the node on which the pod runs. This is crucial for diagnosing whether the pod's behavior is affecting or being affected by the node's state.
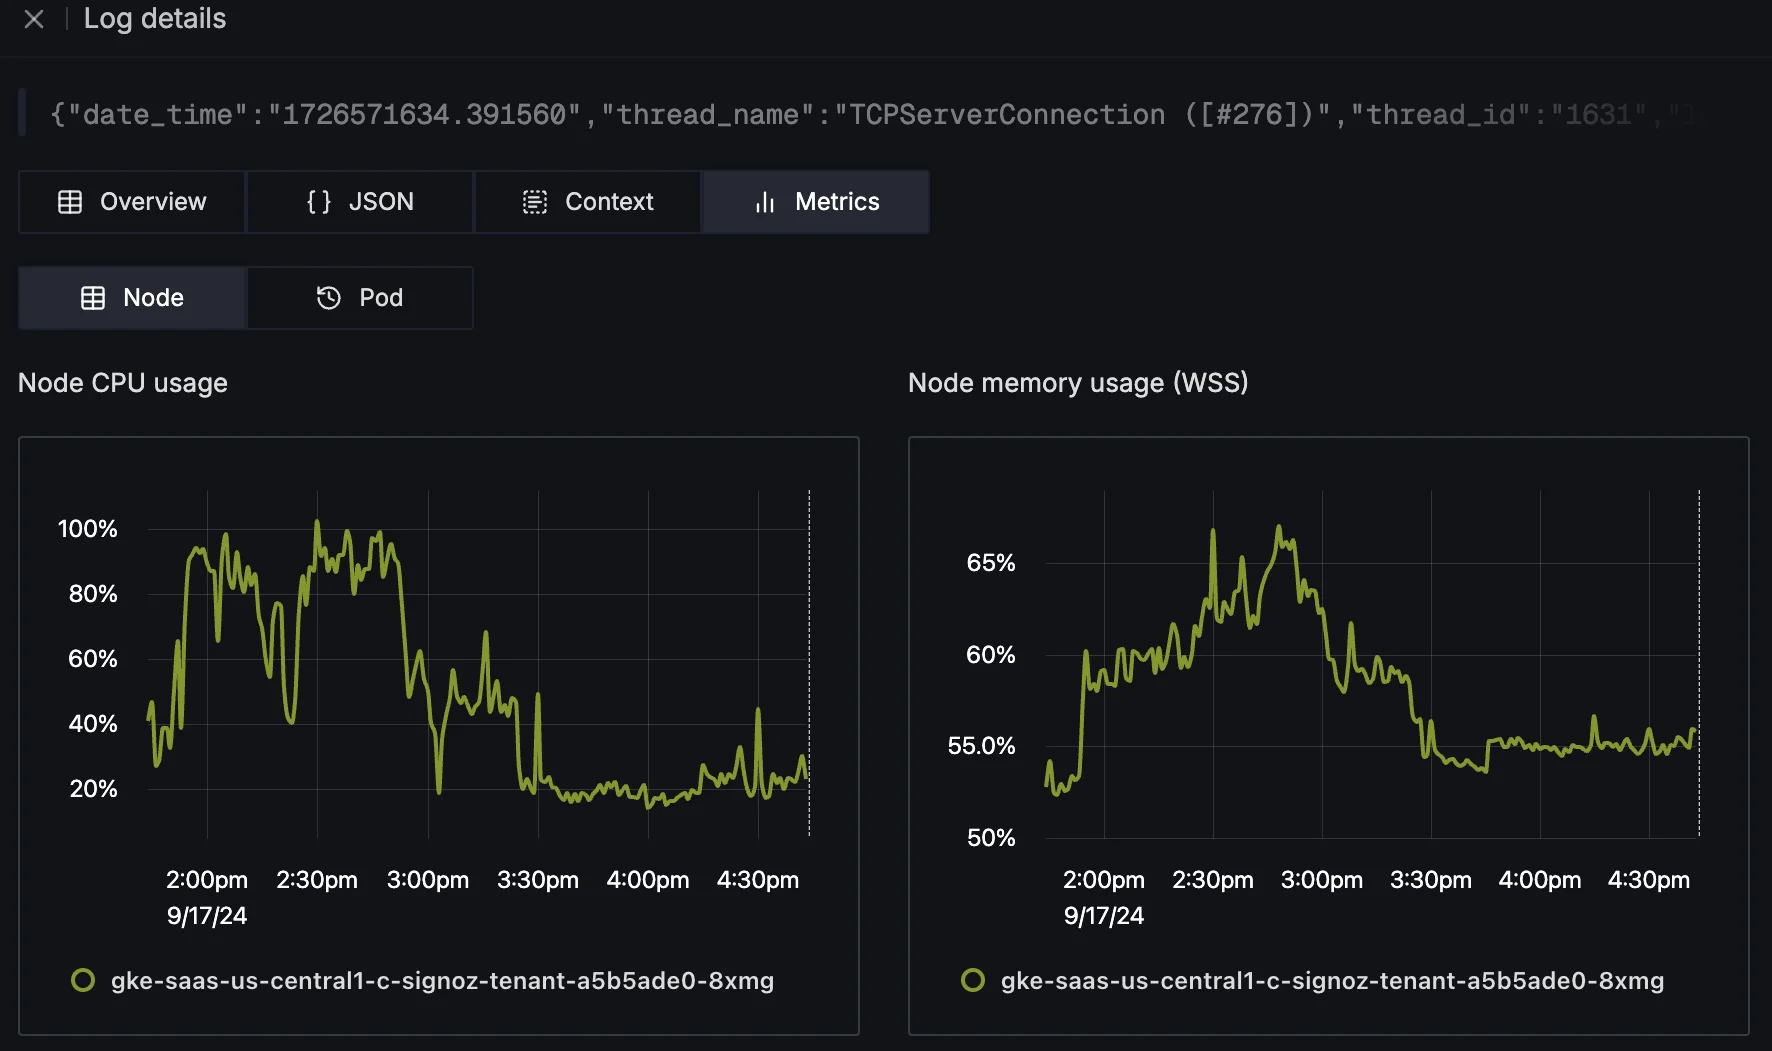
Check Node Metrics associated with the log from a particular K8s node File System and Network Usage: Insights into pod file system usage and network calls, helping you understand how the pod is interacting with other components or external systems.
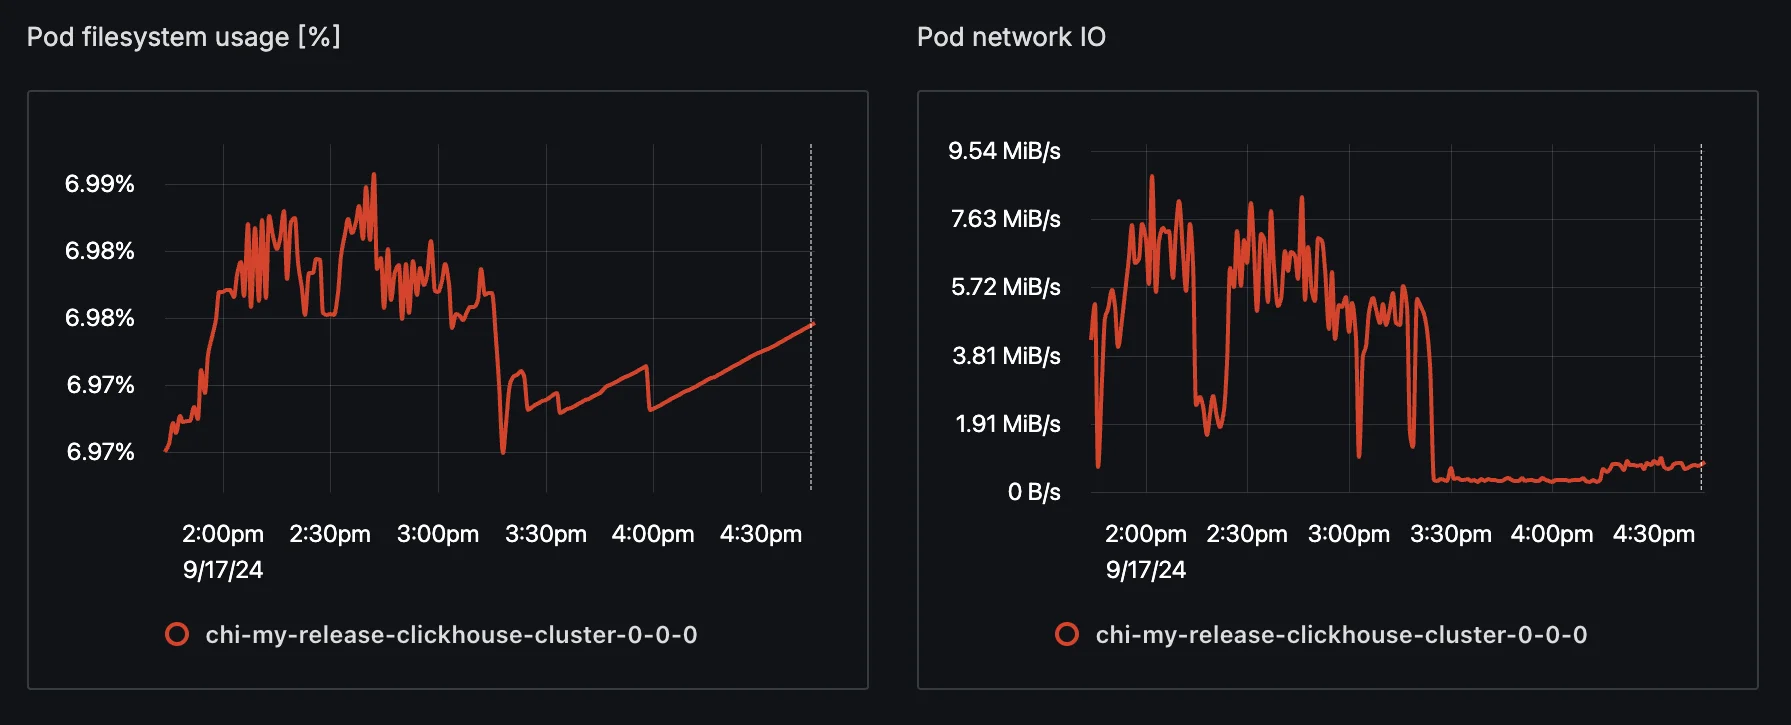
Check file system and network usage to see if there are errors happening there.
The correlation is indicated by a vertical line on the metric graphs, showing the exact timestamp of the log entry. This makes it easy to identify any spikes or resource usage anomalies that align with your logs' errors or warnings.
Not Limited to Kubernetes
While this feature is currently optimized for Kubernetes setups, SigNoz can also handle non-Kubernetes environments like a VM. The relevant infra metrics are displayed when the necessary attributes (e.g., node name) are detected in the logs. If attributes are missing, SigNoz intelligently handles these scenarios by providing an appropriate message.
Upcoming Roadmap
We are just getting started with signal correlation, and here's what's coming next:
- Correlation in All APM Panels: The "View Logs" option will soon be available in other APM panels like DB call metrics and external call metrics, allowing for even deeper correlation between metrics and logs.
- Dedicated Infra Monitoring Module: We plan to introduce a dedicated infra monitoring module, enabling users to start with infra metrics and correlate them with logs and services directly.
- Correlation from Traces to Infra Metrics: We'll extend infra metrics correlation to the trace details page, giving you a holistic view of how your traces and infrastructure interact.
Get Started with Signal Correlation in SigNoz
Correlated infra metrics with logs and logs with APM latency charts will help users troubleshoot with more context. We’re excited to hear from you about these features and ship further improvements.
Feel free to reach out to us through our community Slack channel or email to let us know how these updates enhance your debugging workflow.
By enabling easy correlation between logs, metrics, traces, and infra data, you can troubleshoot issues more quickly and accurately, saving valuable time and effort.
Join us for Launch Week
From Sep 16 to Sep 20, we are announcing a new feature every day at 9AM PT to level up your observability.
Join Us for SigNoz Launch Week 2.0
Day 4 - Alerts History & Scheduled Maintenance


