Jaeger and OpenTracing are both open-source projects. Jaeger was originally built by teams at Uber and then open-sourced. The OpenTracing project was also started by teams at Uber, and hence they are compatible with each other. While Jaeger is an end-to-end distributed tracing tool, OpenTracing is a set of APIs and libraries that can be used to instrument your application.

OpenTracing has officially merged with another open-source project called OpenCensus to form OpenTelemetry, which is emerging as the world standard for creating and managing telemetry data.
If you're looking for an open-source distributed tracing tool, your best option is SigNoz - a full-stack APM and observability tool.
Both projects aimed to solve the pain point of distributed tracing in microservice-based architecture. In a distributed microservice architecture, a single request or transaction can traverse through hundreds of different services. It becomes difficult for engineering teams to identify the exact causes of issues like latency in such a scenario. With distributed tracing, engineering teams can have a central overview of how requests perform across services.
Let's see how Jaeger and OpenTracing play a role in implementing distributed tracing for your application.
What is Jaeger?
Jaeger is a popular open-source distributed tracing tool that was originally built by teams at Uber and then open-sourced. It is used to monitor and troubleshoot applications based on microservices architecture.
It provides instrumentation libraries that were built on OpenTracing standard. For storing trace data, it supports two storage backends:
- Cassandra
- Elasticsearch
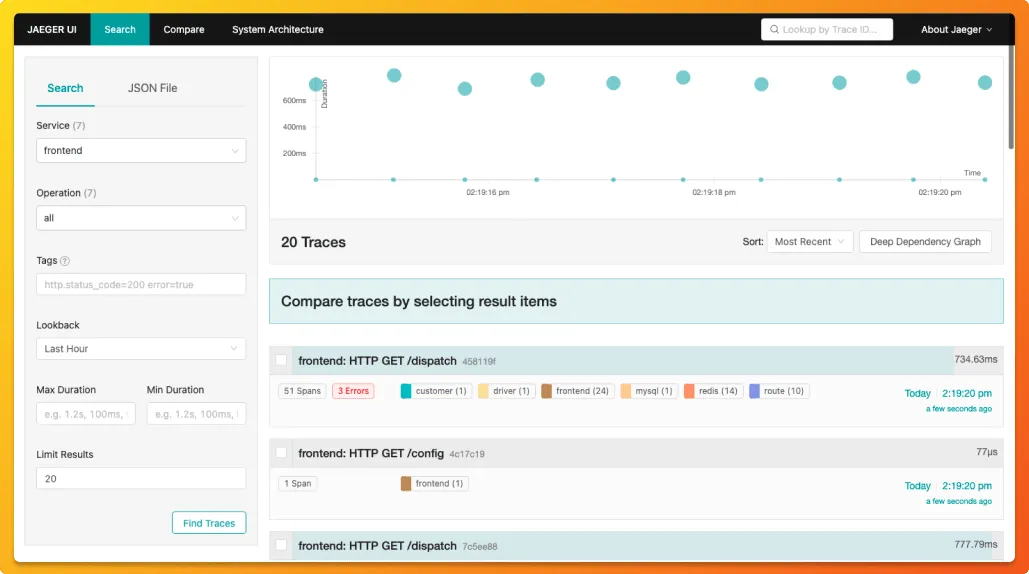
Jaeger provides a minimal UI to analyze the trace data captured.

What is OpenTracing?
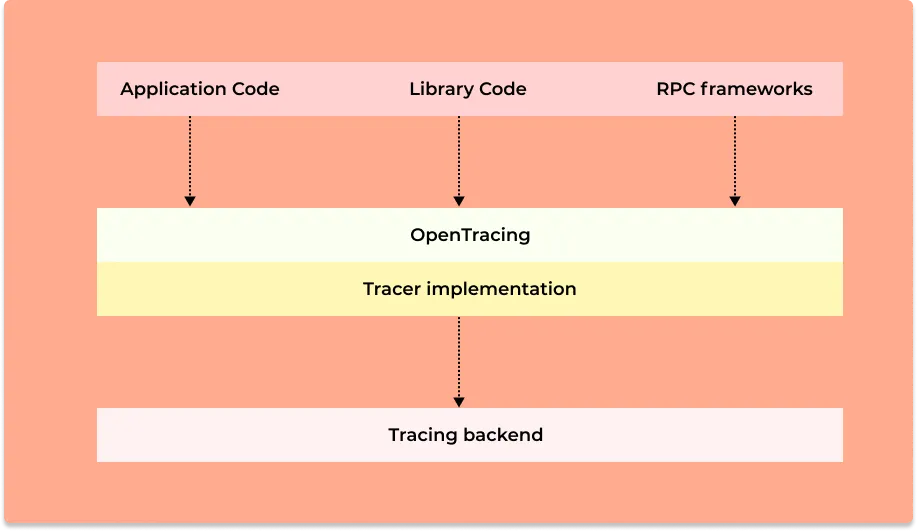
Opentracing was an initiative to enable vendor-neutral instrumentation for distributed tracing. The authors of the OpenTracing project wanted to provide a standard mechanism for instrumentation that does not bind any library or package to any specific vendor.
The authors aimed to create standard instrumentation for all the middleware and the frameworks an application might use.

Comparing Jaeger and OpenTracing
From the description above, you might have a good idea about the differences between Jaeger and OpenTracing. The key difference between the two projects is their scope. While Jaeger is an end-to-end distributed tracing tool, OpenTracing was a project that aimed to standardize code instrumentation for generating and managing telemetry data.
As such, if you're looking to enable distributed tracing, implementing Jaeger is a better option. You can also go with a full-stack open-source tool like SigNoz. Key differences between Jaeger and OpenTracing can be summarised as follows:
- Jaeger is an end-to-end distributed tracing tool, while OpenTracing is an instrumentation library
- Jaeger has a web UI component while you need to select an analysis backend tool while using a instrumentation library like OpenTracing
- Jaeger is an active open-source project, while OpenTracing is no longer actively maintained as the project merged with OpenCensus to form OpenTelemetry
- OpenTracing does not provide an option to store data, while Jaeger supports two popular open-source projects: Cassandra and ElasticSearch for storage
Use-cases of Jaeger and OpenTracing
Both Jaeger and OpenTracing aim to solve the problem of distributed tracing for microservices but at different levels. Let us see the main use-cases of both these projects.
The main use-cases of Jaeger as a distributed tracing tool are as follows:
- Distributed transaction monitoring
- Performance and latency optimization
- Root cause analysis
- Service dependency analysis
- Distributed context propagation
The main use-cases of OpenTracing as a vendor-neutral API and instrumentation library are as follows:
- allows developers to instrument their own code without binding to any particular tracing vendor
- used for standardization of span management APIs
- used for active span management
- provides inter-process propagation APIs
Alternative to Jaeger and OpenTracing
As already mentioned, OpenTracing merged with OpenCensus into a single project called OpenTelemetry. OpenTelemetry is a set of API, SDKs, libraries, and integrations aiming to standardize the generation, collection, and management of telemetry data(logs, metrics, and traces). The data you collect with OpenTelemetry is vendor-agnostic and can be exported in many formats.
The data collected with OpenTelemetry can also be sent to Jaeger's backend. But Jaeger is limited in terms of its UI and does only distributed tracing. For a robust monitoring and observability framework, you need a unified UI for both metrics and traces. And that's where SigNoz is far more suited than Jaeger as a distributed tracing tool.
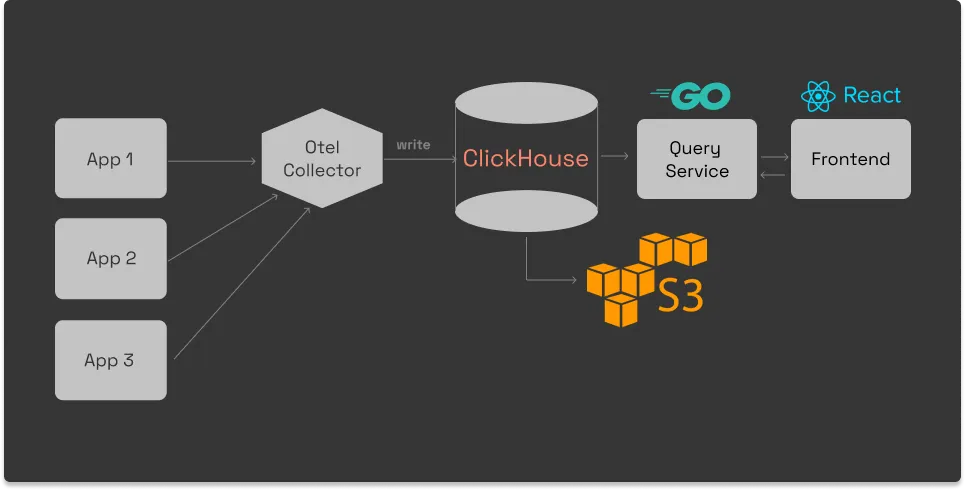
SigNoz is a full-stack open-source application performance monitoring and observability tool which can be used in place of Jaeger. SigNoz is built to support OpenTelemetry natively. SigNoz provides logs, metrics, and traces under a single pane of glass.

SigNoz comes with out of box visualization of things like RED metrics.

Some of the things SigNoz can help you track:
- Application overview metrics like RPS, 50th/90th/99th Percentile latencies, and Error Rate
- Slowest endpoints in your application
- See exact request trace to figure out issues in downstream services, slow DB queries, call to 3rd party services like payment gateways, etc
- Filter traces by service name, operation, latency, error, tags/annotations.
- Run aggregates on trace data
- Unified UI for logs, metrics, and traces
Getting started with SigNoz
SigNoz cloud is the easiest way to run SigNoz. Sign up for a free account and get 30 days of unlimited access to all features.
You can also install and self-host SigNoz yourself since it is open-source. With 19,000+ GitHub stars, open-source SigNoz is loved by developers. Find the instructions to self-host SigNoz.
Frequently asked question
What is OpenTracing used for?
OpenTracing is used for instrumenting application code for distributed tracing. It is now a part of OpenTelemetry, which is emerging as a world standard for generating and managing telemetry data.
How to get started with OpenTracing?
As OpenTracing is no longer maintained, the best option out there is OpenTelemetry, which is backed by all major cloud vendors like Google and Microsoft. The easiest way to get started with OpenTelemetry is to use SigNoz - an open-source APM and observability tool. It uses OpenTelemetry natively to instrument application.
What languages does Jaeger support?
Jaeger client libraries are currently available in Go, Java, Node.js, Python, C++, C#.
Related Content
Jaeger vs Prometheus
Jaeger vs SigNoz
Jaeger vs Zipkin
Jaeger vs DataDog


