Are you looking for Kubernetes monitoring tools? Then you have come to the right place. Kubernetes has grown to become the container orchestration platform of choice. It simplifies managing your containerized workloads. You get the power of automating deployments, scaling resources, and keeping your applications running smoothly. But with great power comes added responsibility. And like any complex system, Kubernetes needs monitoring.

Kubernetes monitoring tools provide insights into resource usage, container health, and application performance. This enables you to optimize your workload and proactively prevent problems.
This article lists the top 11 monitoring tools - ranging from open-source to SaaS solutions.
List of top 11 Kubernetes monitoring tools:
- Signoz (Open-Source)
- Prometheus (Free)
- Grafana (Open-Source)
- Kubernetes Dashboard (Free)
- cAdvisor (Free)
- Sentry.io
- EFK Stack
- New Relic + Pixie
- Dynatrace
- Datadog
- Sematext
SigNoz and Grafana can be self-hosted for free where you will only have to pay for infra and maintenance costs.
Why is Kubernetes Monitoring Important?
Here are the top benefits of Kubernetes monitoring:
- It helps you identify performance issues, which include insufficient resources, pod failures, or high CPU usage.
- You get real-time performance insights that enable you to take quick action.
- There’s complete visibility into your cluster and nodes. This helps you identify any issues and locate areas of improvement.
- With proper monitoring, you can drill down into issues quickly and efficiently to identify the root cause and resolve problems faster.
- You can proactively identify and address potential issues before they impact your applications or users.
- Provide your developers with insights into application performance and troubleshooting tools for faster debugging.
Top Kubernetes Monitoring Tools at a glance
| Best For | Standout Feature | Pricing | |
|---|---|---|---|
| SigNoz | OpenTelemetry native monitoring, 3 signals in a single pane, ClickHouse-based storage. | Open-source. Track MELT under a single pane of glass. Correlation between signals. | Free community edition. $199/month for cloud. Custom price for enterprises. |
| Prometheus | Storing time-series metrics. | PromQL — A powerful and flexible query language. | Free to use. |
| Grafana | Integrations with multiple data sources. | Rich dashboard with different plotting options. | Free tier. Pay as you go tier. $299/month for advanced bundle. |
| Kubernetes Dashboard | Simple monitoring for small clusters. | It’s natively part of Kubernetes. | Free to use. |
| cAdvisor | Auto-discovery and support for REST endpoints. | Open-source. | Free to use. |
| Sentry | Detailed monitoring across services and transactions. | Comprehensive tracking and deep insights. | Free tier with limited features. Team starts at $26/month (billed annually) |
| EFK | Log monitoring and analysis. | Multiple data sources can be connected. | Free to use. |
| New Relic | All-in-one monitoring with heavy integrations. | AI assistant - New Relic Grok. | Free tier with 100GB/month data ingest. Custom pricing with the pay-as-you-go model. |
| Dynatrace | Automatic out-of-the-box alerting. | Dynatrace operator for Kubernetes. | Free trial. Usage-based pricing. |
| Datadog | Cloud-based APM solution. | Datadog agent to run in Kubernetes cluster. | Starts at $15 per-month per-host (billed annually) |
| Sematext | Provides integration for Kubernetes monitoring | Sematext agent collects important logs & metrics | Infra monitoring starts at $3.6 per host per month for 5 containers per host. |
Top Kubernetes Monitoring Tools
Signoz
Signoz is an Application Performance Monitoring (APM) tool that provides the added benefits of logs, metrics, exceptions, and alerts. What sets Signoz apart is that it’s OpenTelemetry-Native. Why does OpenTelemetry matter? Let’s take a glance:
- It’s open-source and standardized. You are free from vendor lock-ins.
- Installation and integration are simple, with little to no code.
Now that you know the benefits of OpenTelemetry, let’s take a look at the benefits of Signoz:
Features of SigNoz
- Get application metrics such as p90, p99, error, and request rates right out of the box.
- Monitor Rate-Error-Duration (RED) metrics.
- External calls, including database calls, are monitored.
- Logs, metrics, and traces under a single pane of glass.
- ClickHouse-based storage is much more efficient than ELK and Grafana Loki for storing logs.
- Create feature-rich dashboards to chart out any metrics - from JVM to Prometheus-exposed ones.
The community edition is free for use if you’re planning to host it on your own infra. If you’re looking for a SaaS solution, then SigNoz cloud is your answer.
Prometheus
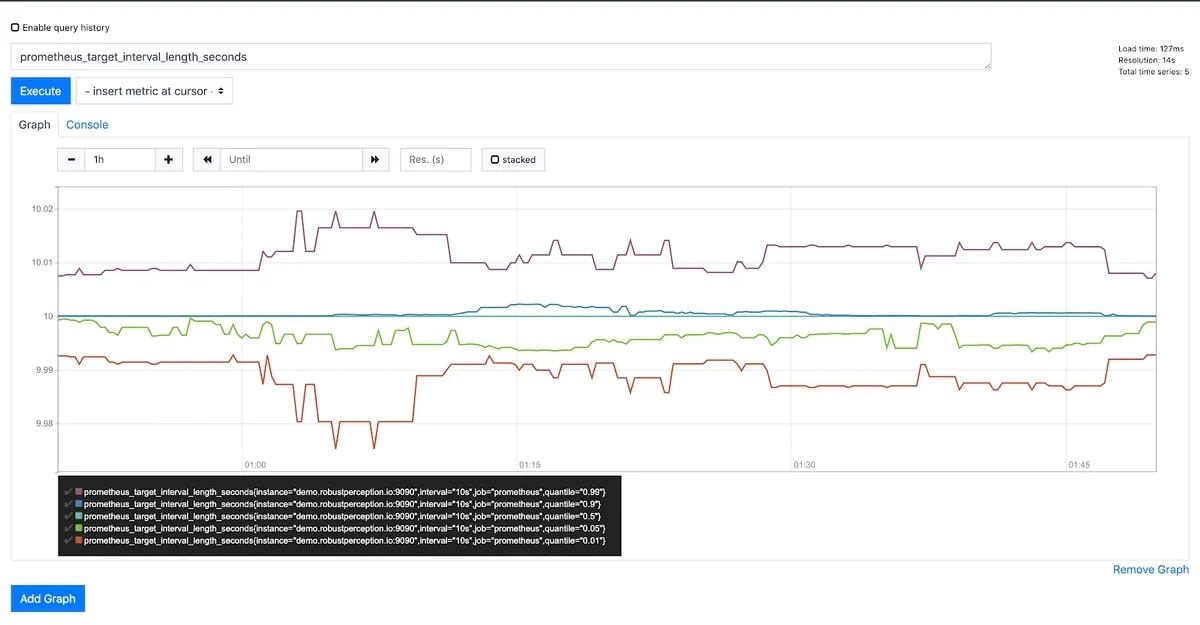
Developed by SoundCloud, and now a part of the CNCF (Cloud-Native Computing Foundation), Prometheus is the next tool on our list. At its core, Prometheus is a time-series database. What sets it apart is its flexible query language - PromQL.
For monitoring via Prometheus, your applications running on Kubernetes need to expose metrics at the /metrics endpoint. While manual configuration is an option, the Prometheus Operator makes your life easy.
Features of Prometheus
- Utilizes a pull model for collecting metrics rather than applications having to push data.
- Support for client libraries for different languages.
- Built-in expression browser for quick visualization.
- Strong community support.
| Pros | Cons |
|---|---|
| Flexible query language - PromQL | Aggregated metrics might not reveal actual numbers |
| Allows third-party integrations | Only supports metrics; no support for logs or traces |
| Highly dimensional data model based on key-value pairs | Built-in visualization is limited |
Grafana

You cannot talk about Prometheus without mentioning Grafana. Grafana comes with its own stack called LGTM - Logs (Grafana Loki), Grafana (Dashboard visualization), Traces (Grafana Tempo), and Metrics (Grafana Mimir and Prometheus).
While Prometheus is a popular choice for monitoring Kubernetes, the Grafana dashboard can also connect with other databases, such as InfluxDb.
Features of Grafana
- Can connect to different data sources.
- Powerful visualization support, which is highly customizable.
- Full Kubernetes monitoring using Grafana Cloud - from Clusters to individual Pods.
| Pros | Cons |
|---|---|
| Support for multiple data sources | Large number of queries might slow down the dashboard load time |
| Extensive visualization with support for alerts | Learning curve for different data sources |
| Highly dimensional data model based on key-value pairs | Limited out-of-the-box support for Kubernetes |
Kubernetes Dashboard
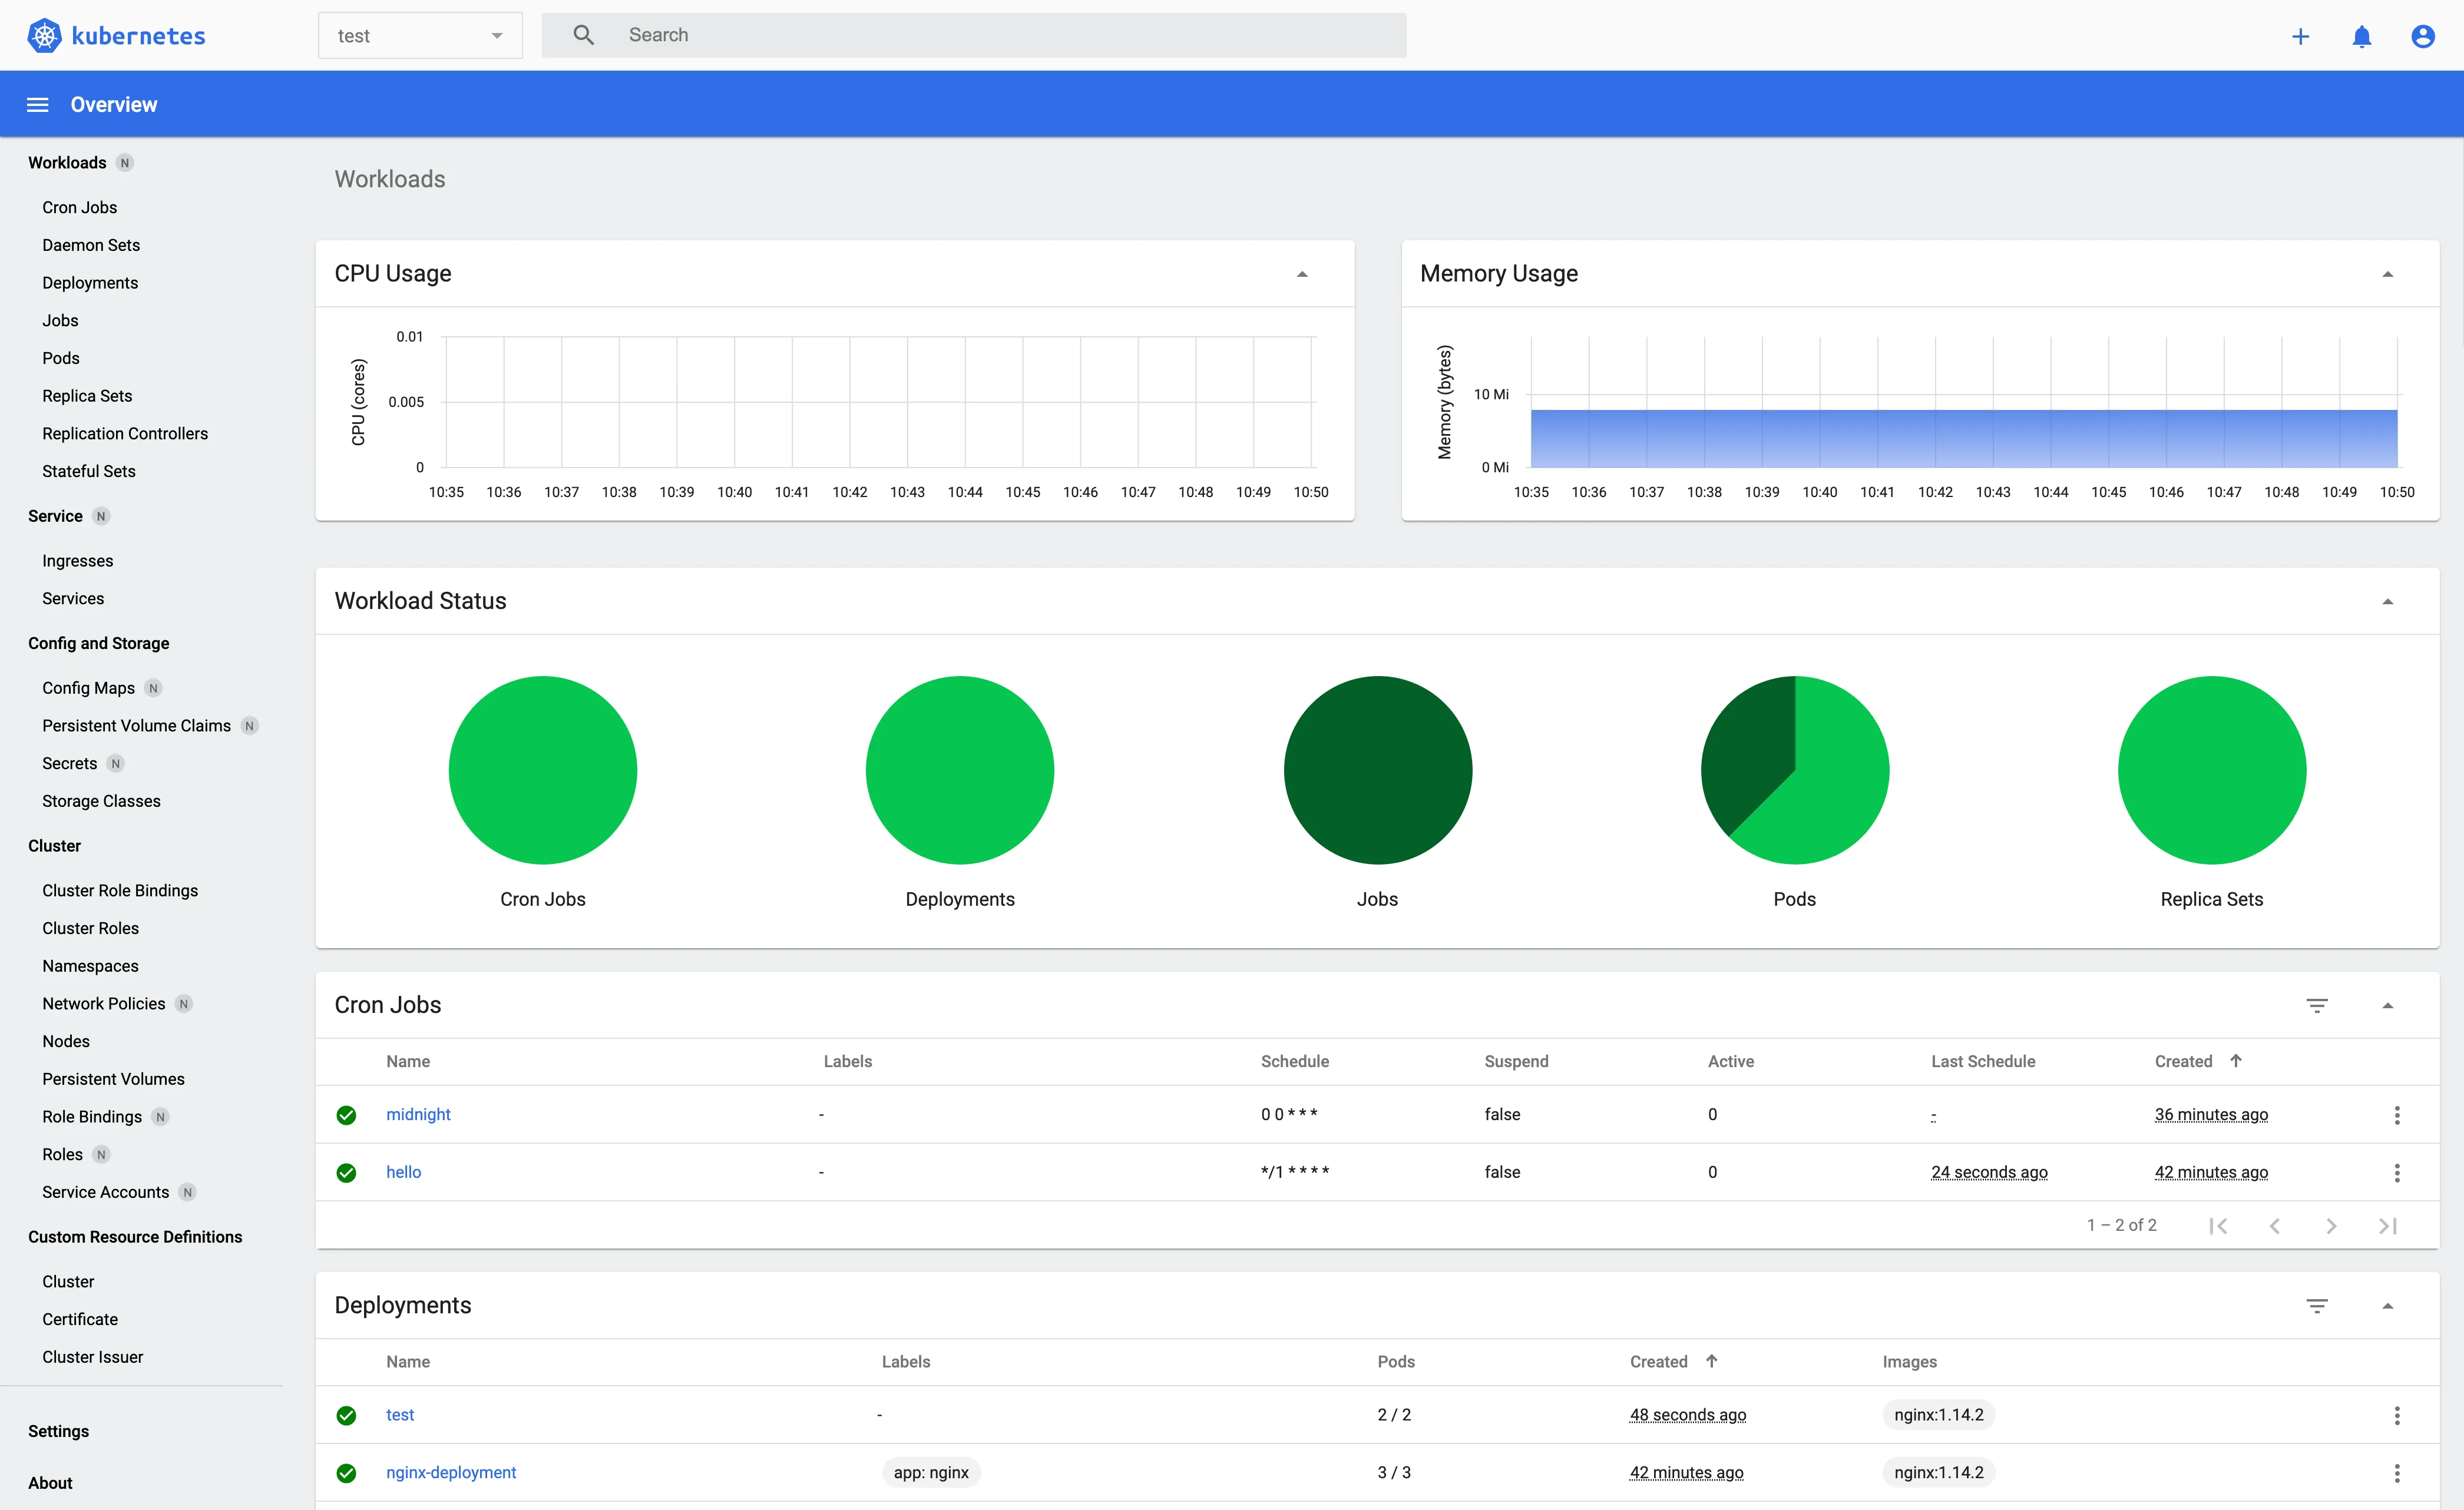
If you're looking for a simple UI for monitoring your Kubernetes workload, then the Kubernetes Dashboard might be the choice for you. You can deploy, manage, and troubleshoot your cluster resources.
Kubernetes Dashboard is perfect for small clusters or if you're just starting out with Kubernetes and want to explore monitoring.
Features of Kubernetes Dashboard
- It’s a part of Kubernetes, and deploying is easy with the
kubectlcommand - Monitor CPU and memory utilization, along with health statistics across all nodes
| Pros | Cons |
|---|---|
| Part of Kubernetes, making it easy to install | Limited functionality |
| Provides CPU, Memory, and Health Statistics | Does not scale with a large cluster |
| Allows deployment and troubleshooting | No support for logs and traces |
cAdvisor
Container Advisor, commonly known as cAdvisor, is an open-source container resource collector. It provides you with insights into resources along with the performance characteristics of your containers.
With native support for Docker containers, you can run cAdvisor as a daemonset for Kubernetes.
Features of cAdvisor
- Per-node operation with auto-discover of all containers in it.
- Collects CPU, Memory, Network usage, and histograms of complete historical resource usage.
- Has a Web UI and exposes REST endpoints.
- Supports exporting data in different formats such as for ElasticSearch.
| Pros | Cons |
|---|---|
| Uses https://github.com/kubernetes-sigs/kustomize for Kubernetes daemonset | No long-term storage or analysis capabilities |
| Provides CPU, Memory, and Health Statistics | Does not collect application-specific metrics or logs |
| Allows deployment and troubleshooting | Increased complexity as it requires additional tools |
Sentry.io
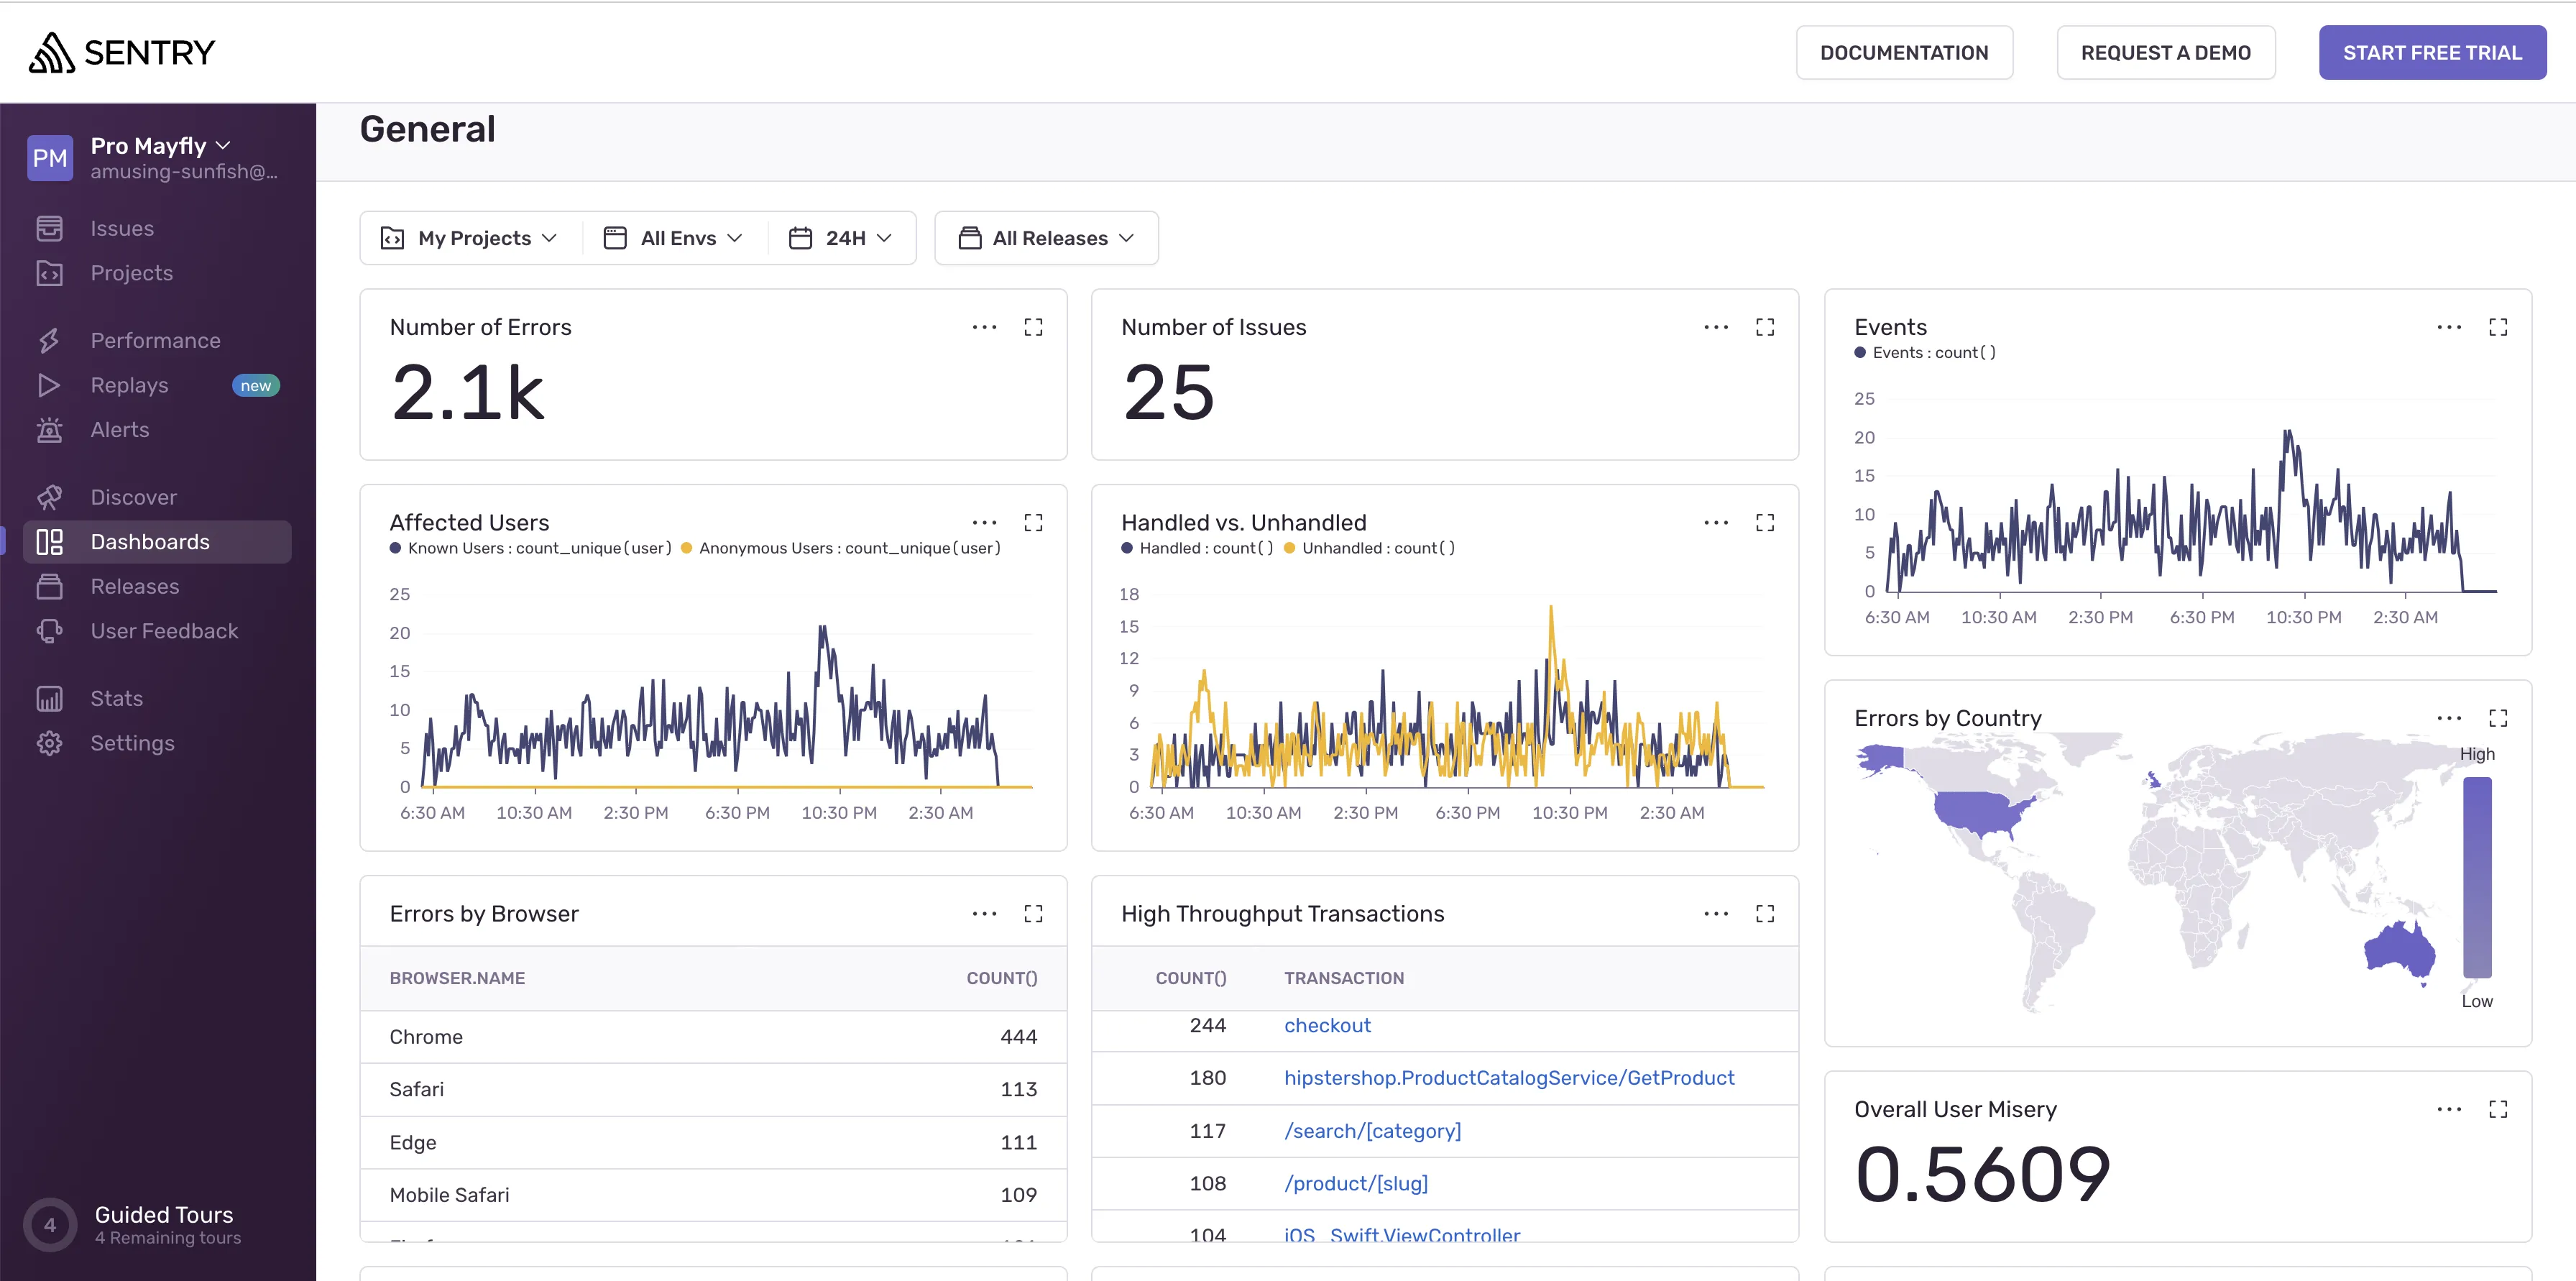
Beyond basic metrics and logs, Sentry.io offers comprehensive error tracking and performance monitoring coupled with deep insights into your cluster's health.
Sentry is a powerful option having its primary focus on identifying and resolving issues before they impact your users. This makes it a valuable addition to any Kubernetes monitoring strategy.
It comes with sentry-kubernetes, a beta-versioned Kubernetes event reporter.
Features of Sentry
- Automatically captures and groups errors, eliminating noise - including noise from Kubernetes itself.
- Analyzes application performance across services and transactions.
- Provides actionable data on errors - including stack traces, user information, and affected versions.
| Pros | Cons |
|---|---|
| Capture and analyze all errors, including application exceptions and Kubernetes events. | Requires additional configuration to utilize Kubernetes-specific features. |
| Monitor across services, transactions, and individual operations | Learning curve for complex deployments |
| Access detailed information on errors | Free-tier has limited error and performance monitoring |
EFK Stack
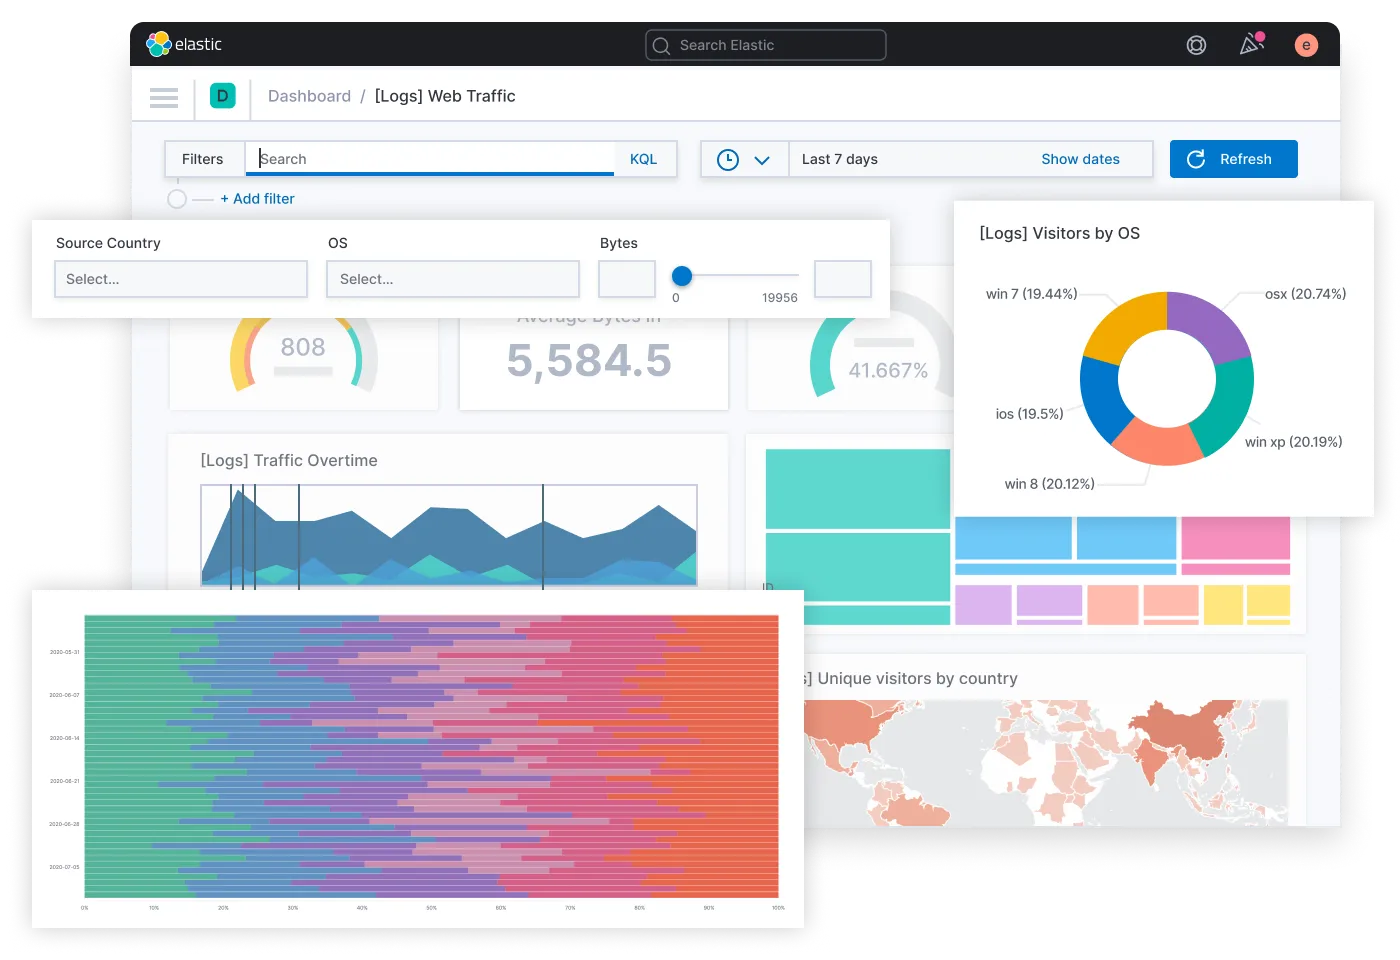
Are you looking to put more focus on log monitoring and analysis for your Kubernetes cluster? EFK might fit your needs. EFK stands for ElasticSearch (central storage for logs), Fluentd (log collector), and Kibana(visualization layer).
ElasticSearch is deployed as statefulset as it holds the log data, while Fluentd is deployed as daemonset, which collects container logs from each node.
Features of EFK
- Supports multiple data sources and integrations, allowing you to collect and analyze logs from applications, containers, and infrastructure.
- Scales horizontally, making it ideal for large-scale deployments and high-volume log data.
- EFK is free to use and benefits from a large and active community.
| Pros | Cons |
|---|---|
| Provides near real-time log visibility across all containers | Can be complex to set up individual components to run |
| Allows you to configure alerts based on events | Often becomes resource-intensive to run on the same cluster |
| Scales out easily as you add pods | Needs additional security measures to be added |
New Relic + Pixie
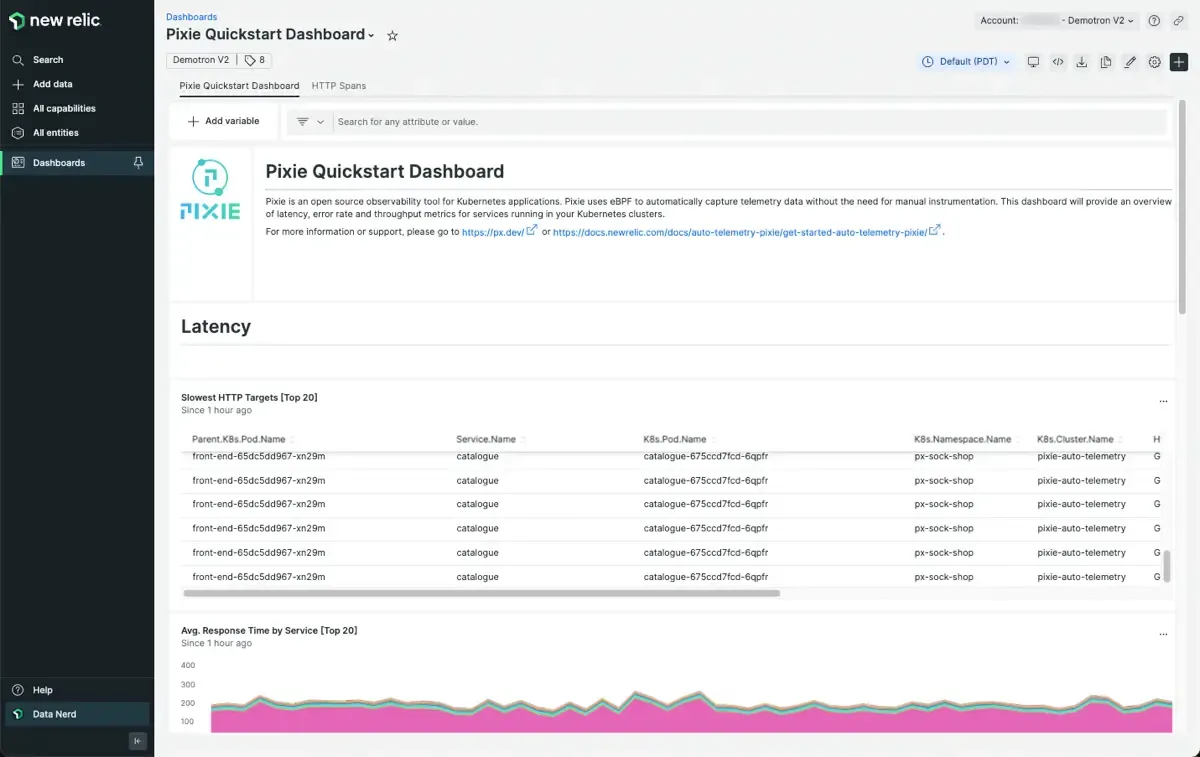
New Relic is an All-In-One observability platform offering 700+ external integrations. New Relic has its own Kubernetes integration that makes it easy for you to monitor your Kubernetes workloads. It has a dedicated UI navigator for this built on top of the New Relic Navigator.
You also get integration with Pixie to step up your monitoring needs. With this, you get Pixie’s advanced Kubernetes observability alongside incident correlation, intelligent alerting, and long-term retention.
Features of New Relic (with Pixie)
- Long-term storage of Pixie telemetry data.
- Pixie is language-agnostic - no instrumentation expertise is needed.
- Provides a rich and curated UI that simplifies complex environments.
| Pros | Cons |
|---|---|
| Auto-telemetry with Pixie that collects MELT from cluster, applications, OS, and network | Paid subscription for all features |
| No need for manual code change for monitoring | This can lead to vendor lock-in |
| The benefit of having AI assistant - New Relic Grok | Interface and features can be complex for users unfamiliar with the platform |
Dynatrace
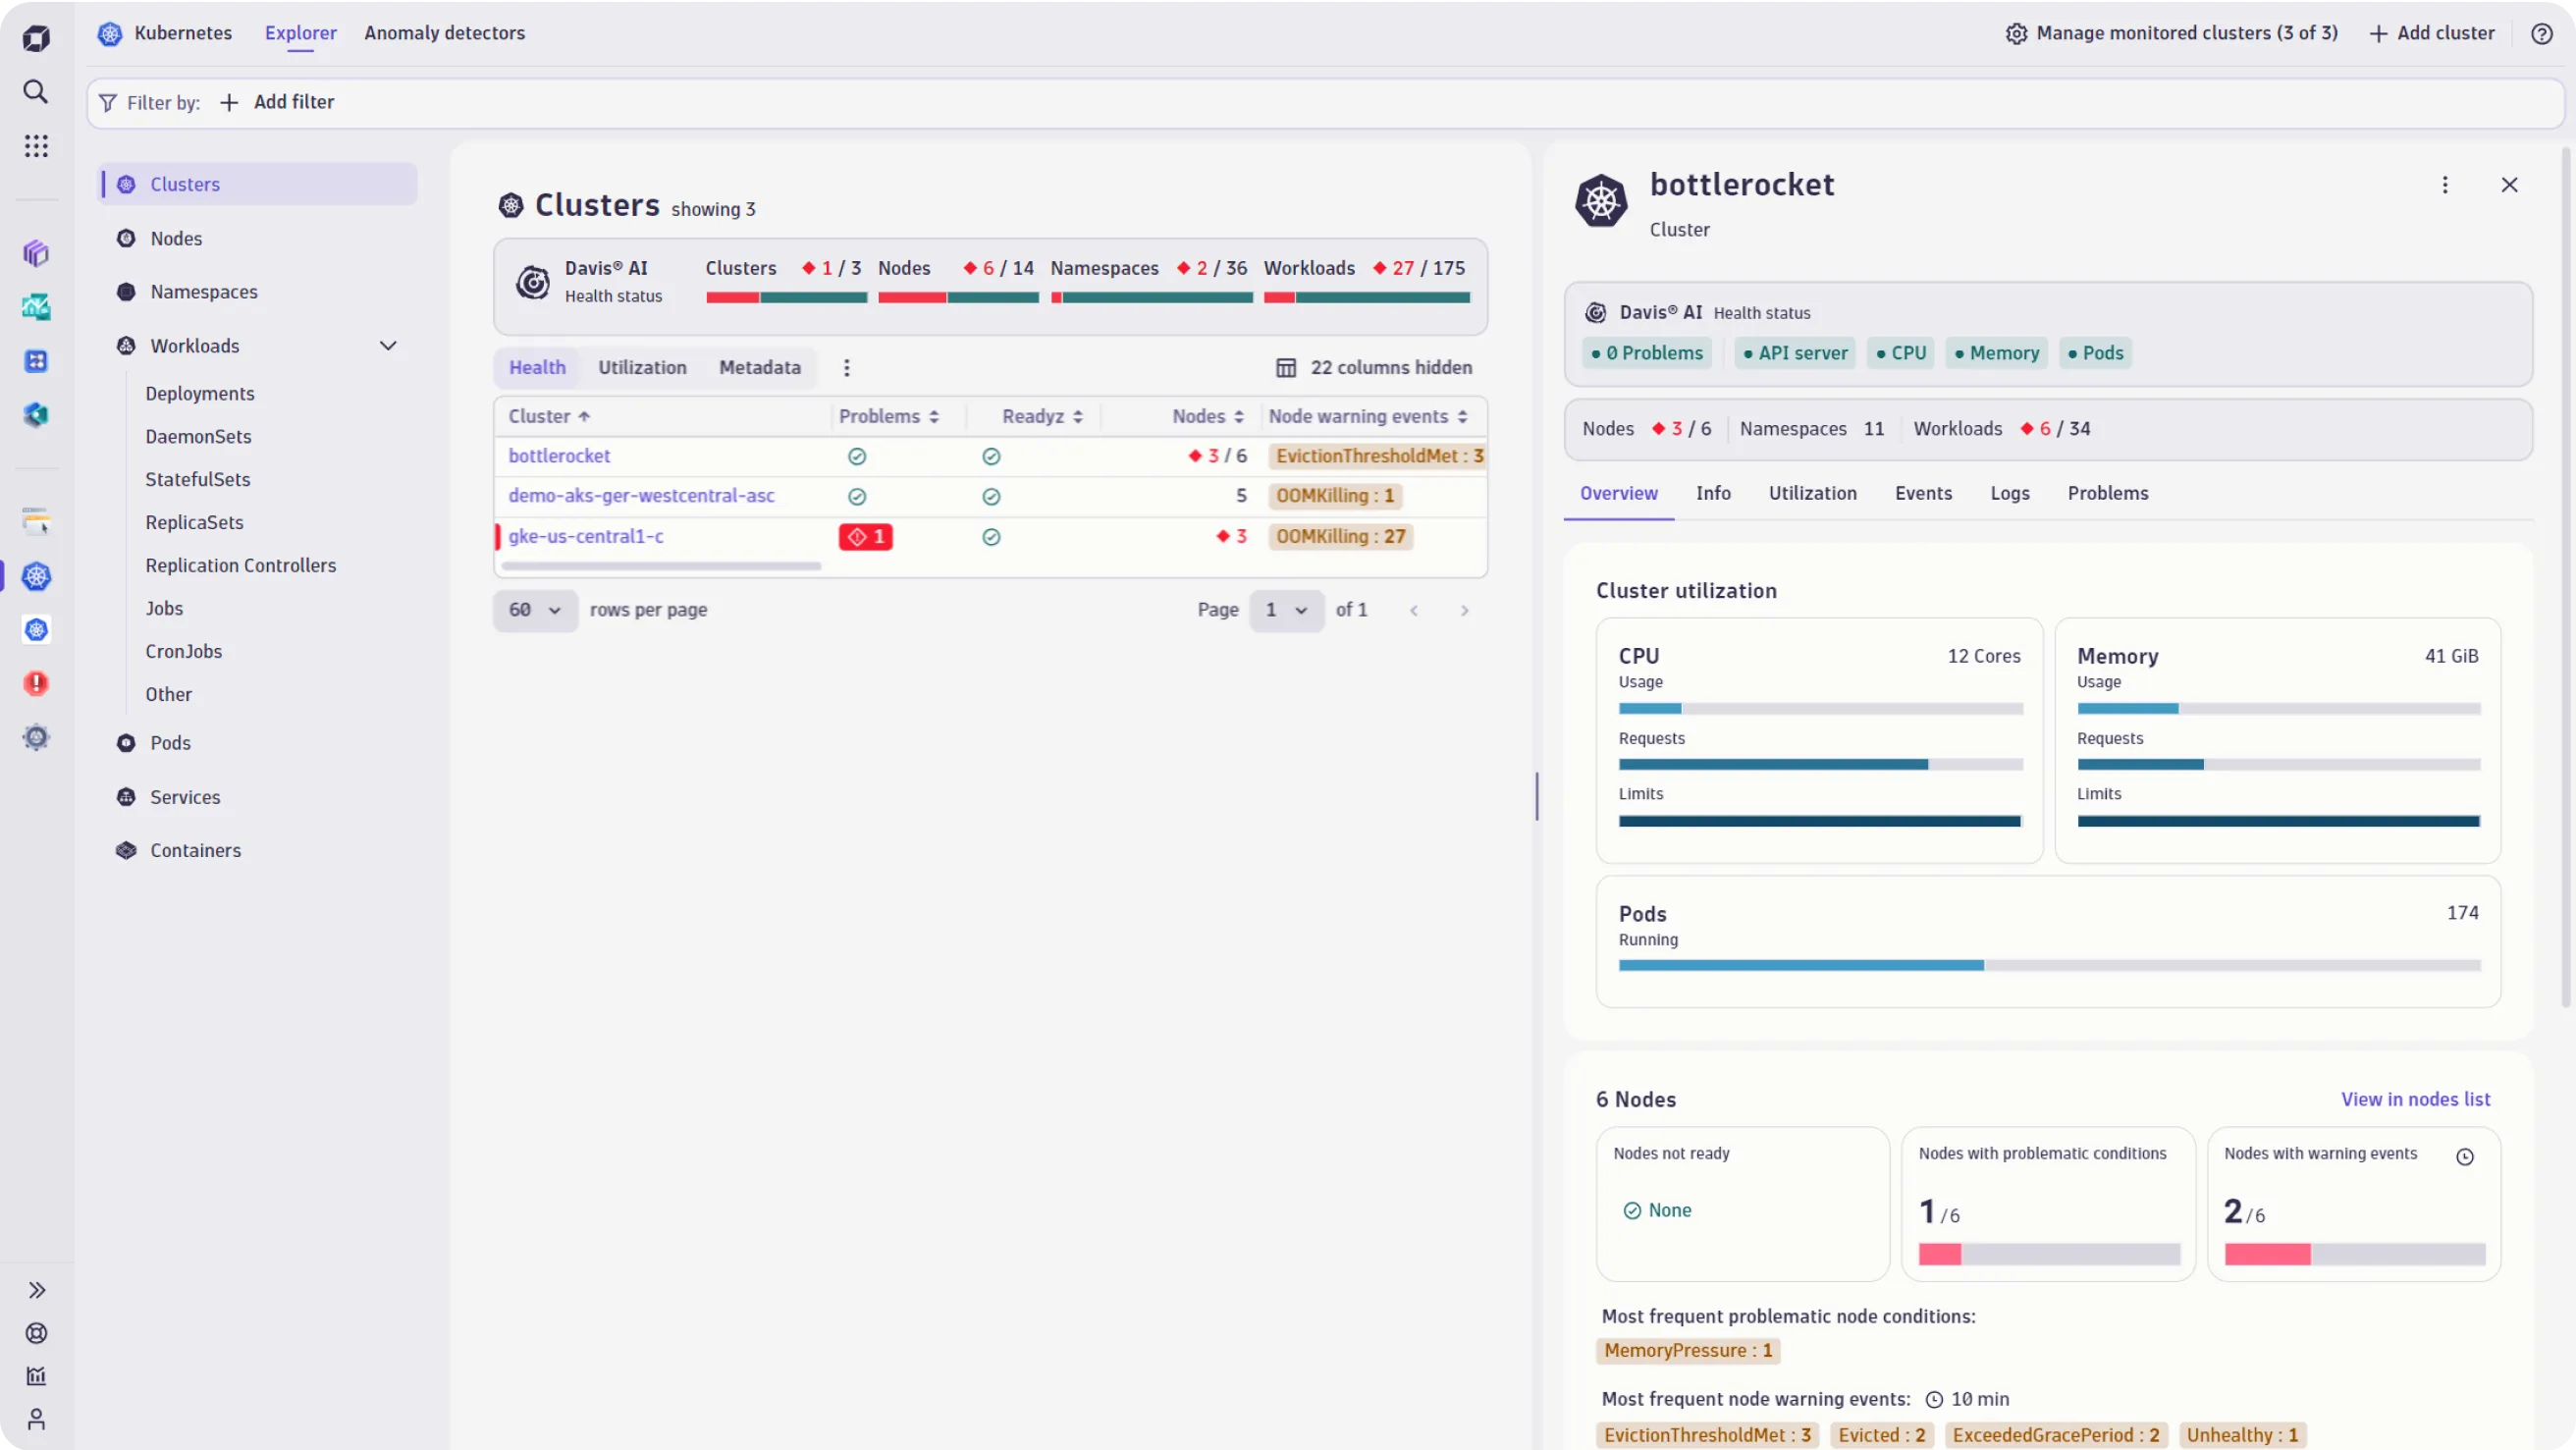
Dynatrace offers a unified observability and security platform for cloud workloads. Be it infrastructure, application monitoring, or security analysis, Dynatrace has a solution.
For your Kubernetes monitoring needs, it offers a Dynatrace Operator that allows you to connect with your cluster automatically. You get support for top Kubernetes distributions, including EKS, AKS, and GKE.
Features of Dynatrace
- Automatic out-of-box alerting for Kubernetes
- Continuous discovery and monitoring of nodes and pods
- Unified view for metrics, events, and logs
| Pros | Cons |
|---|---|
| AI-powered anomaly detection and root cause analysis | Paid subscription for all features used |
| Monitor cluster resource utilization and reallocate resources based on need | Resource heavy for clusters exceeding 50 nodes |
| Continuous discovery and monitoring with log analytics | Limited customization with open-source tools |
Datadog
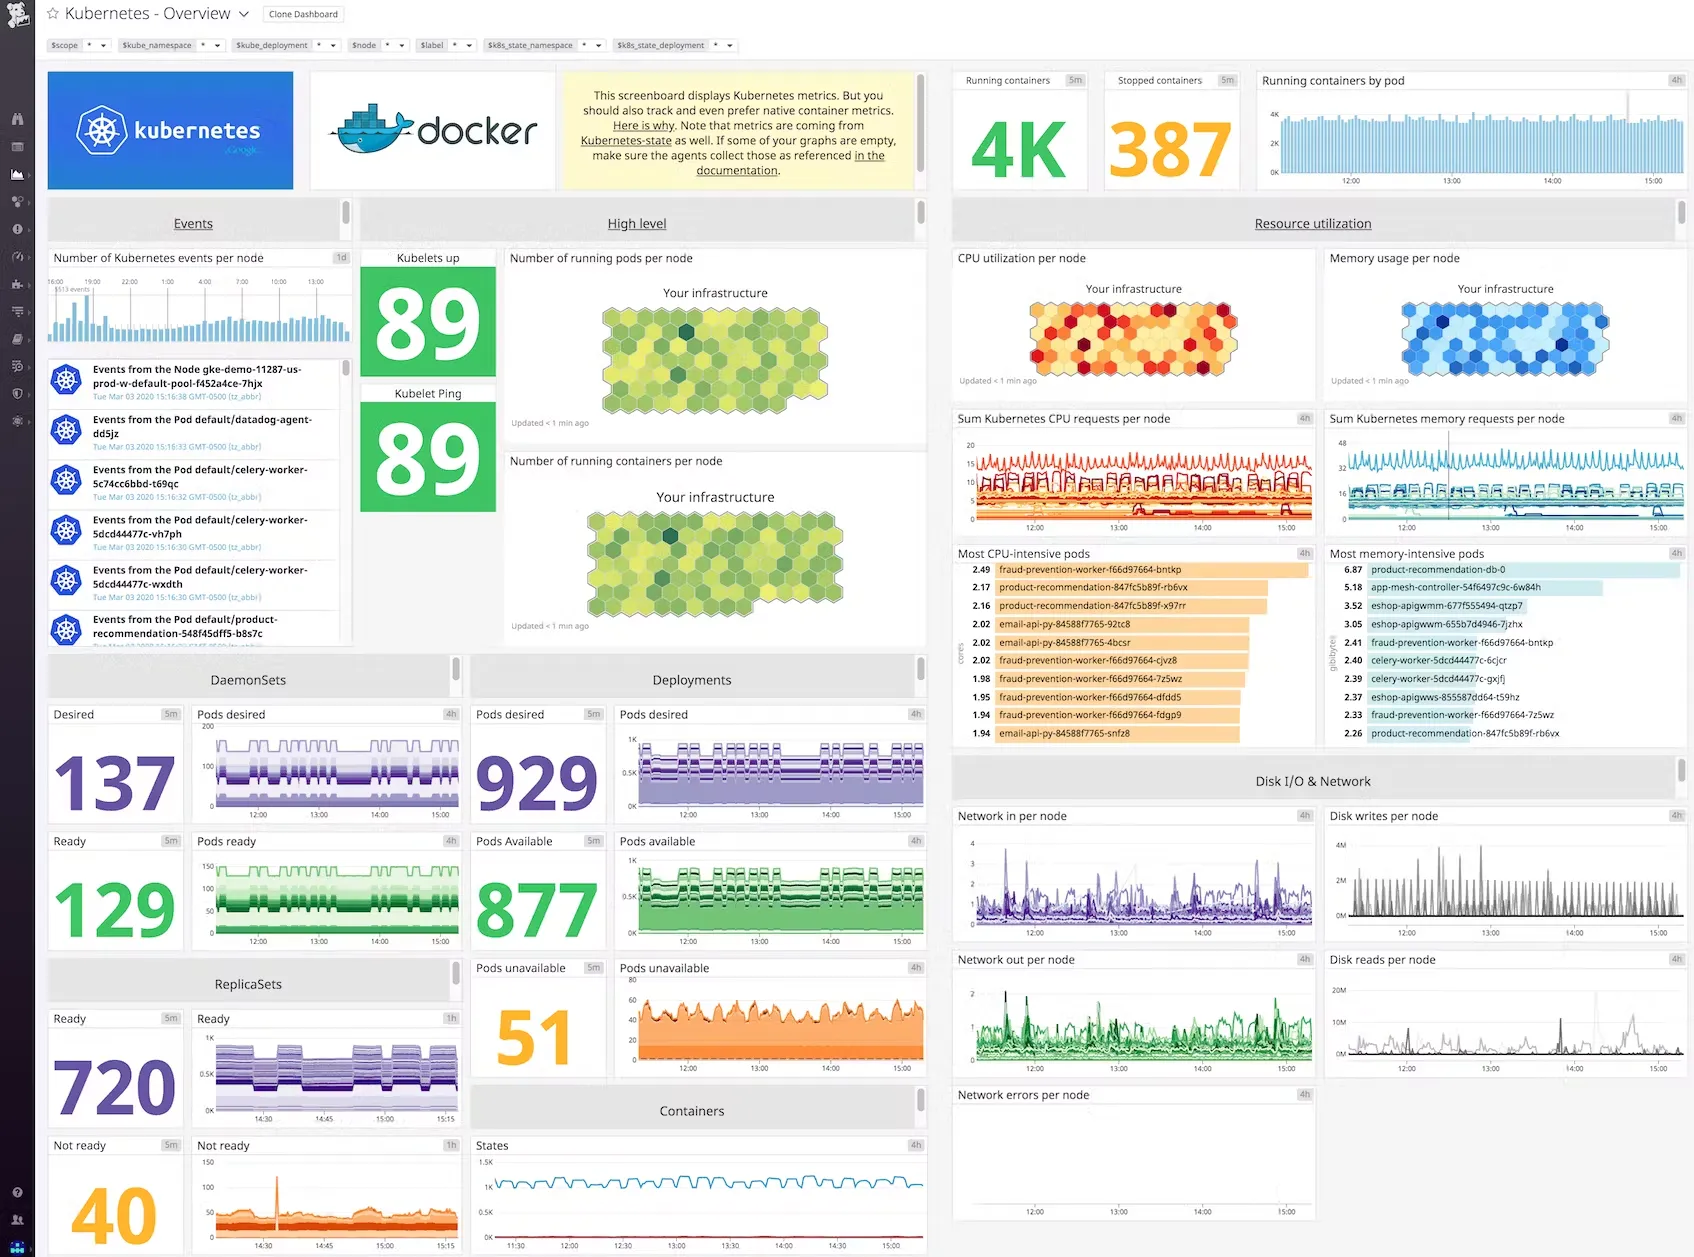
Datadog is a cloud-based APM solution that allows you to monitor logs, metrics, events, and service states from Kubernetes in real-time. Datadog provides you with its own Datadog Agent that you can run in your Kubernetes cluster. It will start collecting the application and cluster metrics.
Features of Datadog
- Customizable alerting and support for multiple channels.
- Provides transaction-level insight into your applications.
- Has pre-built dashboards and monitors for Kubernetes resources.
| Pros | Cons |
|---|---|
| Easy to install as a daemonset | UI might be complex and doesn't provide deep insights |
| Built-in Kubernetes dashboard | Needs root access for agent installation |
| Costly for smaller teams and workloads |
Sematext
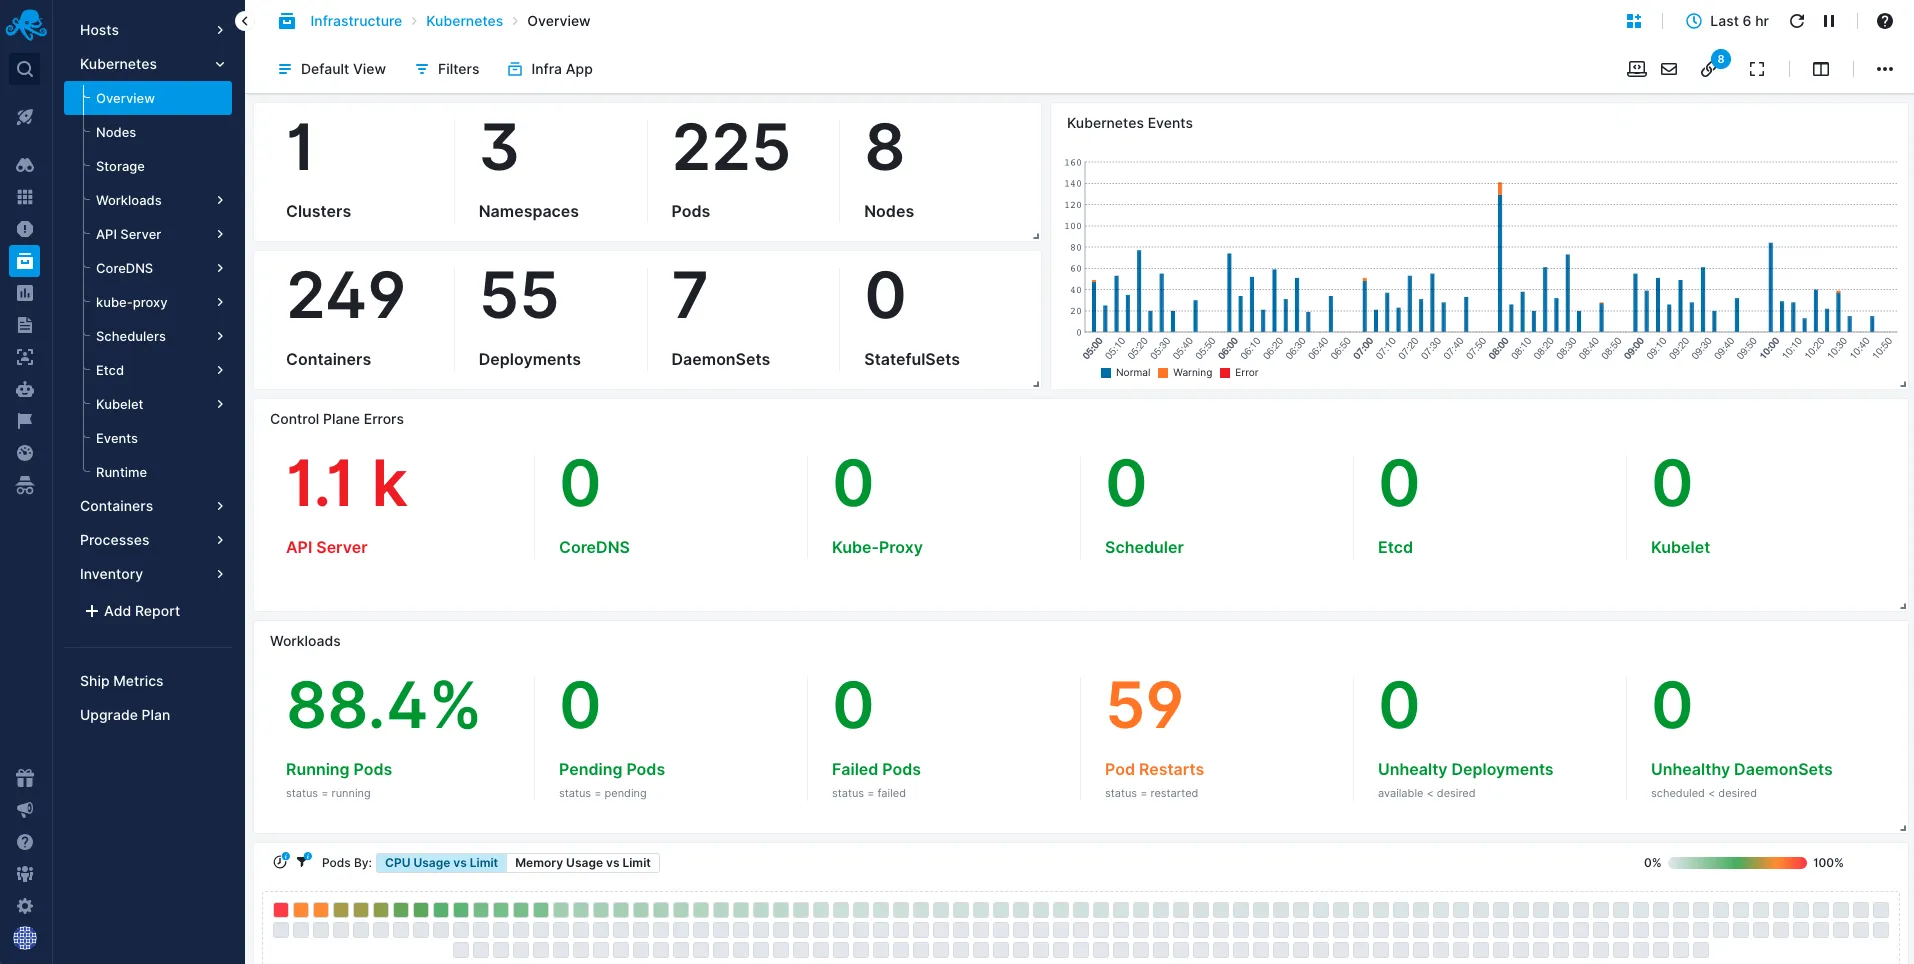
Sematext offers a comprehensive solution for Kubernetes monitoring, with a focus on providing centralized visibility and detailed insights into the entire Kubernetes infrastructure. It is designed to help DevOps teams quickly identify and resolve issues, enhancing overall system performance and reducing downtime.
Features of Sematext
- Comprehensive Monitoring: Sematext offers centralized monitoring of all Kubernetes components, providing metrics, logs, and events for a complete overview of cluster health and performance.
- Real-Time Insights and Dashboards: It features real-time monitoring and customizable pre-built dashboards, enabling quick insights and analysis of Kubernetes environments.
- Advanced Log Management: Sematext's log management automatically structures container and pod logs, facilitating efficient troubleshooting and error log correlation with metric spikes.
| Pros | Cons |
|---|---|
| Offers detailed oversight of Kubernetes clusters. | Requires acclimation to advanced features. |
| Provides immediate monitoring feedback with adaptable dashboards. | Potentially expensive for smaller teams. |
| Efficient log structuring and analysis. | May be complex to integrate with various tools. |
| Suitable for varying sizes of Kubernetes environments. | Extra effort to tailor alerts and dashboards. |
Factors To Consider When Choosing a Kubernetes Monitoring Tool
Let’s take a look at the top factors you should consider before choosing a Kubernetes monitoring tool for your Kubernetes workload:
- Functionality - It should support metrics coverage, alerting, logging, and troubleshooting. Additionally, it should be scalable and have security measures.
- Integration - Your monitoring tool won’t operate in a silo. Support for integrations is always important, be it with cloud platforms, CI/CD pipelines, or other tools.
- Ease of use - A factor often overlooked, but ease of use is important. Does the tool come with a proper installation guide along with documentation? Does the UI/UX feel responsive and fit your needs?
- Support - Next comes support. Community support is as important as support from official channels. Make sure you check the SLAs.
- Future-proofing - When you're going for a tool, chances are you're not going to change it soon. You need to ensure that the solution is stable and has a future roadmap ready.
Conclusion
Effective Kubernetes monitoring is vital for optimizing containerized workloads. Among the top Kubernetes monitoring tools are Signoz, Prometheus, Dynatrace, and Datadog, each offering unique benefits. Key factors for selecting a Kubernetes monitoring tool include functionality, integration ease, user-friendliness, support, and adaptability to future needs. Each tool serves specific demands, aiding in tailored decision-making based on individual monitoring requirements.
For a straightforward and comprehensive solution, SigNoz excels with its open-source, OpenTelemetry-native platform. It's a full-stack APM ideal for metrics monitoring, distributed tracing, and log management, catering to diverse monitoring needs efficiently.
Further Reading

