If you're looking for an open-source alternative to New Relic, then you're at the right place. SigNoz is a perfect open-source alternative to New Relic. SigNoz provides a unified UI for metrics, traces and logs with advanced tagging and filtering capabilities.

In today's digital economy, more and more companies are shifting to cloud-native and microservice architecture to support global scale and distributed teams. But distributed systems also make it impossible for engineering teams to track how user requests perform across services. Application performance monitoring tools provide the visibility needed to resolve performance issues quickly in distributed systems.
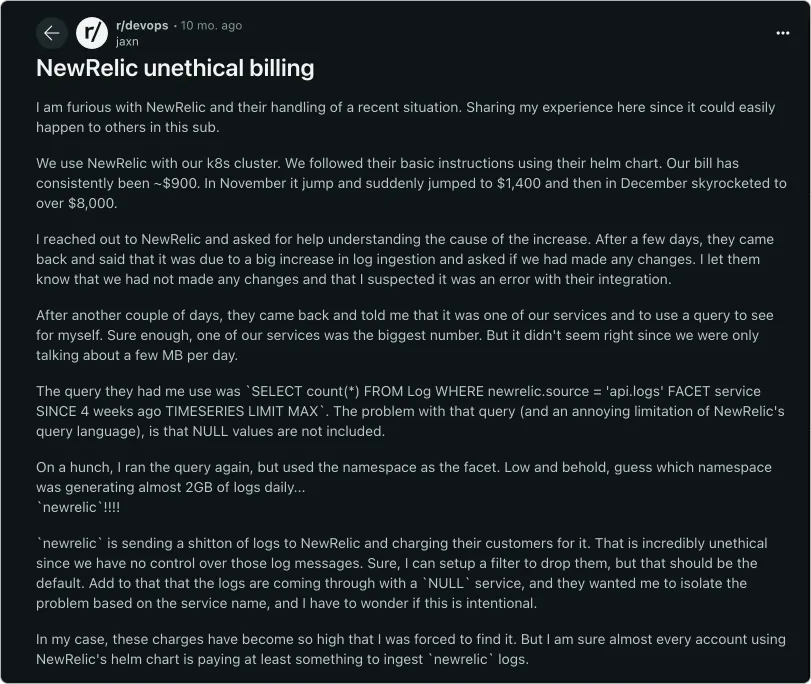
New Relic is a great SaaS tool when it comes to application performance monitoring. But there are a few challenges when it comes to enterprise SaaS products, and it's just not a great fit for every company.
Some of the challenges with tools like New Relic includes:
- It is cloud-only, so not suitable for companies that have concerns with sending data outside their infra
- For any small feature, you are dependent on their roadmap. We think this is an unnecessary restriction for a product which developers use. A product used by developers should be extendible
- User-based pricing. New Relic charges based on user seats which can get very expensive in case of large engineering teams.
- Pricing plans of enterprise tools can sometimes leave you in a lurch with frequent changes.
Some of the key features of good observability tools are:
- Logs, metrics, and traces under a single pane of glass
- Out of the box application metrics
- Way to go from metrics to traces to find why some issues are happening
- Seamless flow between metrics, traces & logs — the three pillars of observability
- Filtering of traces based on different tags and filters
- Ability to set dynamic thresholds for alerts
- Transparency in pricing
Why choose an open-source alternative to New Relic?
APM and observability tools are critical tools in a developer's kit. These tools improve developer efficiency, save bandwidth by resolving issues quickly, and increase developer productivity.
An open-source product is always a better choice for any developer tool. Some of the key advantages of open-source developer tools are:
Open codebase
Developers can judge the quality of the code of the tool they want to choose and work with.Extensibility
If an extra feature or customization is required, developers can build on top of the open-source tool without waiting for the enterprise support team to include their request in the next product cycle.Community support
One of the best parts about open-source projects is the community. An example is OpenTelemetry, which is becoming the world standard for generating and managing telemetry data in cloud-native applications.Transparency
With open-source projects, you know what you're dealing with. There is no black box.On-prem installation
If your data privacy policies are stringent, you can use open-source tools within your infra with no fear of breaching data privacy laws like GDPR.
But most open-source projects don't provide a great user experience as SaaS products do. It takes a lot of time and effort to get them working, figuring out the long-term storage, etc.
And that's where SigNoz shines. It is very simple to get started, supports multiple tech-stack, and comes with a SaaS-like web user experience.
Key Features of SigNoz
Some of our key features which makes SigNoz vastly superior to current open-source products and a great alternative to New Relic are:
- Metrics, traces, and logs under a single pane of glass
- Opentelemetry-native
- Correlation of telemetry signals based on OpenTelemetry's semantic conventions
- Out of the box charts for application metrics
- Seamless flow between metrics, traces & logs
- Distributed tracing with Flamegraphs & Gantt charts to visualize user requests
- Filtering based on tags & attributes
- Custom aggregates on filtered traces
- Monitoring of messaging queues
- Infrastructure dashboards
- Exceptions monitoring
- Transparent usage data & pricing
Application metrics
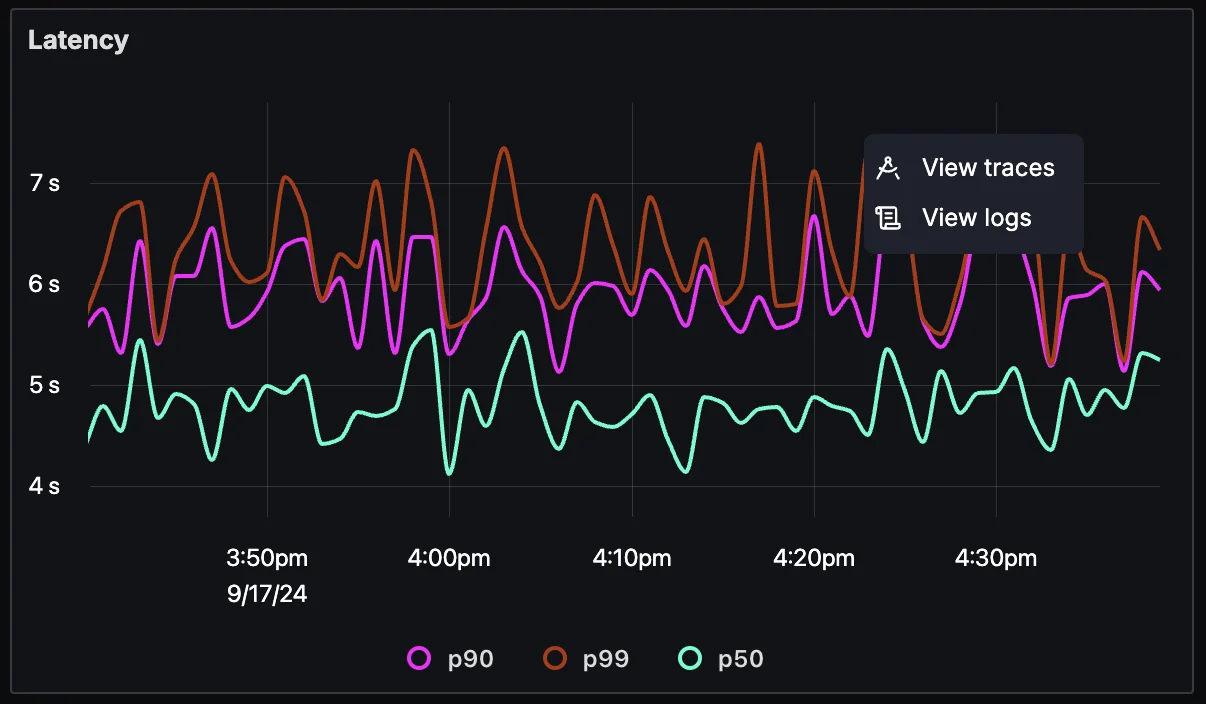
Get out of the box p90, p99 latencies, RPS, Error rates and top endpoints for a service out of the box.

Seamless flow between telemetry signals
Powered by OpenTelemetry's semantic conventions, you can quickly jump between telemetry signals in SigNoz. Found something suspicious in a metric, just click that point in the graph & get details of traces which may be causing the issues. Seamless, Intuitive.
Similarly, we have enabled correlation between other telemetry signals.
APM Metrics to Traces & Logs
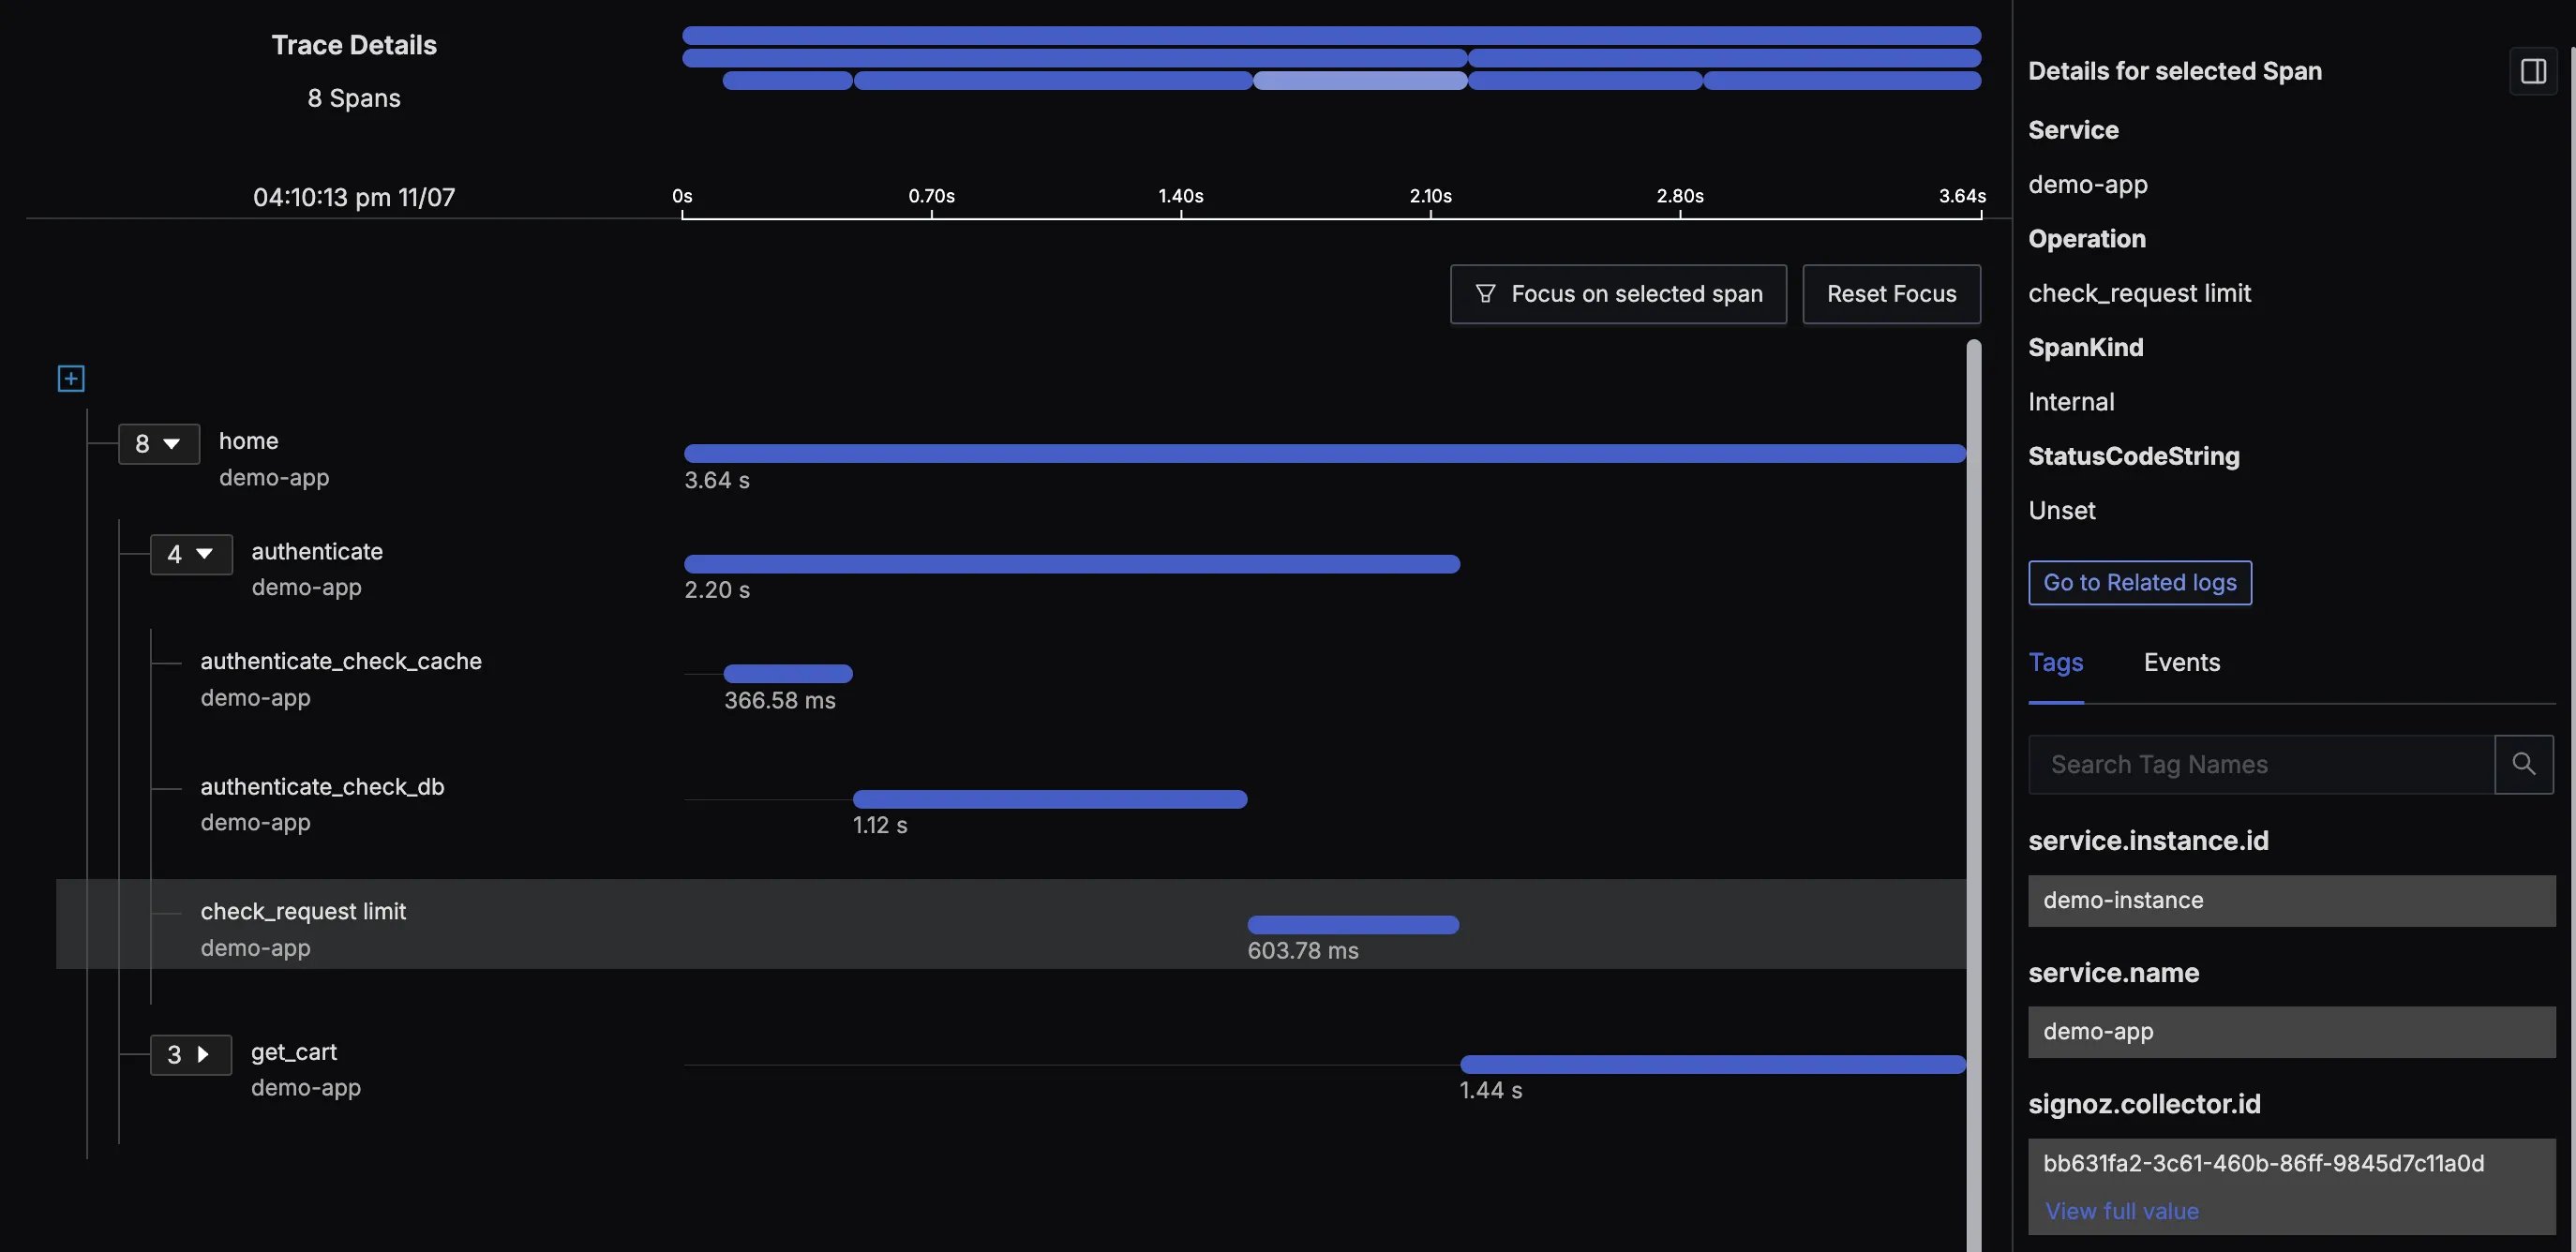
Traces to Logs
If you see a API call taking more time than usual, you can go to related logs to investigate further.
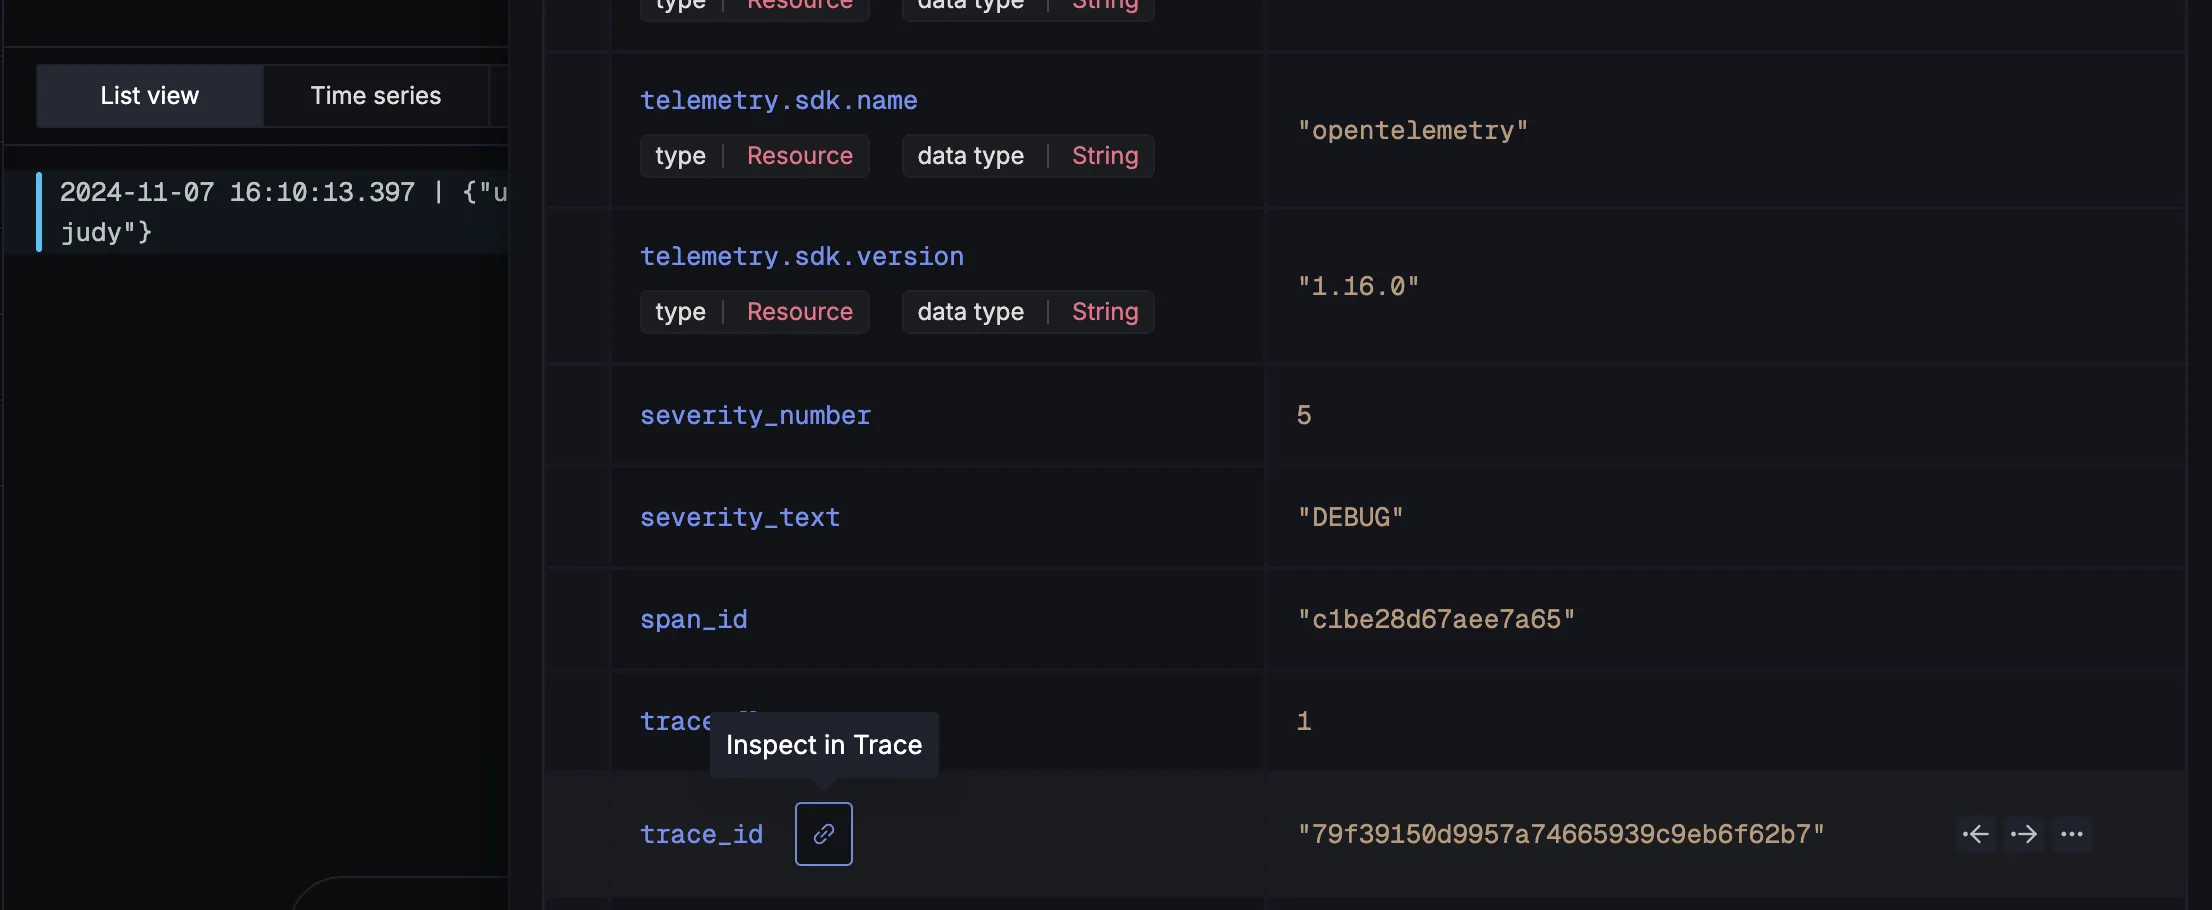
Similarly you can click on detailed view of logs and then go to related trace ID to see the flow of user requests.
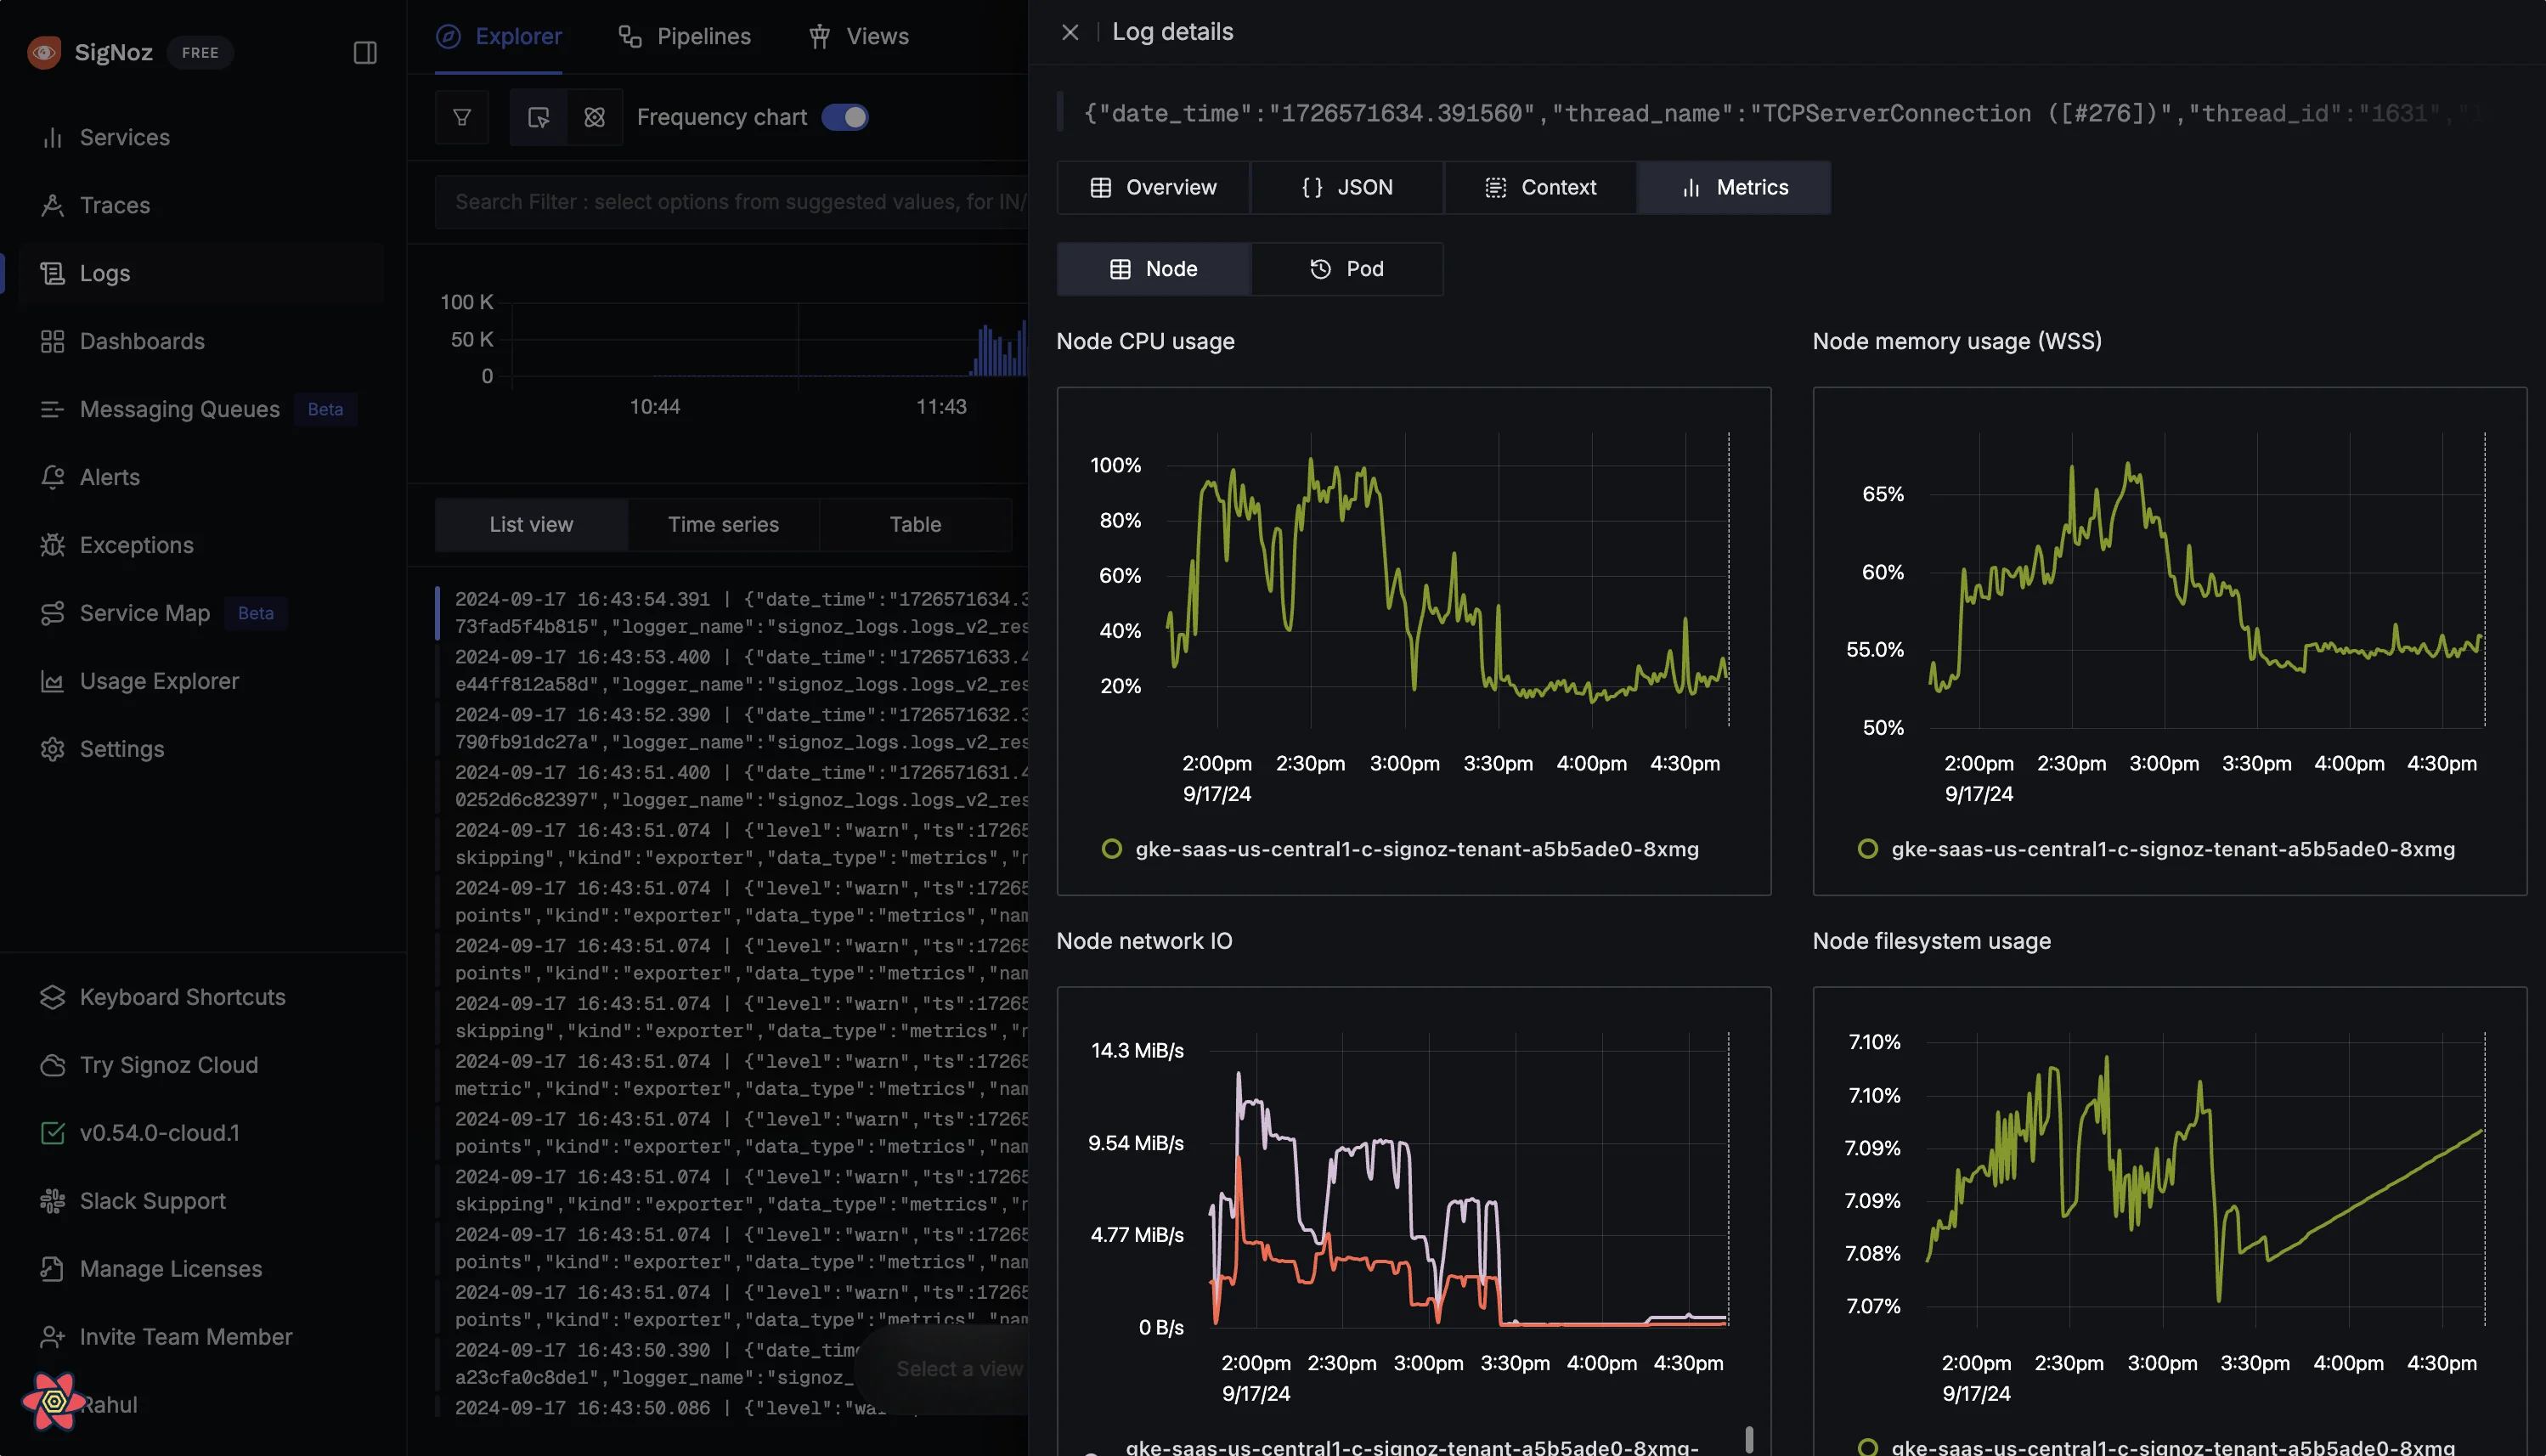
Logs with Infrastructure metrics
While troubleshooting with logs, you can investigate the related infrastructure metrics to see if issues are happening becuase of that.
Quick filers & Advanced Query Builder for all telemetry signals
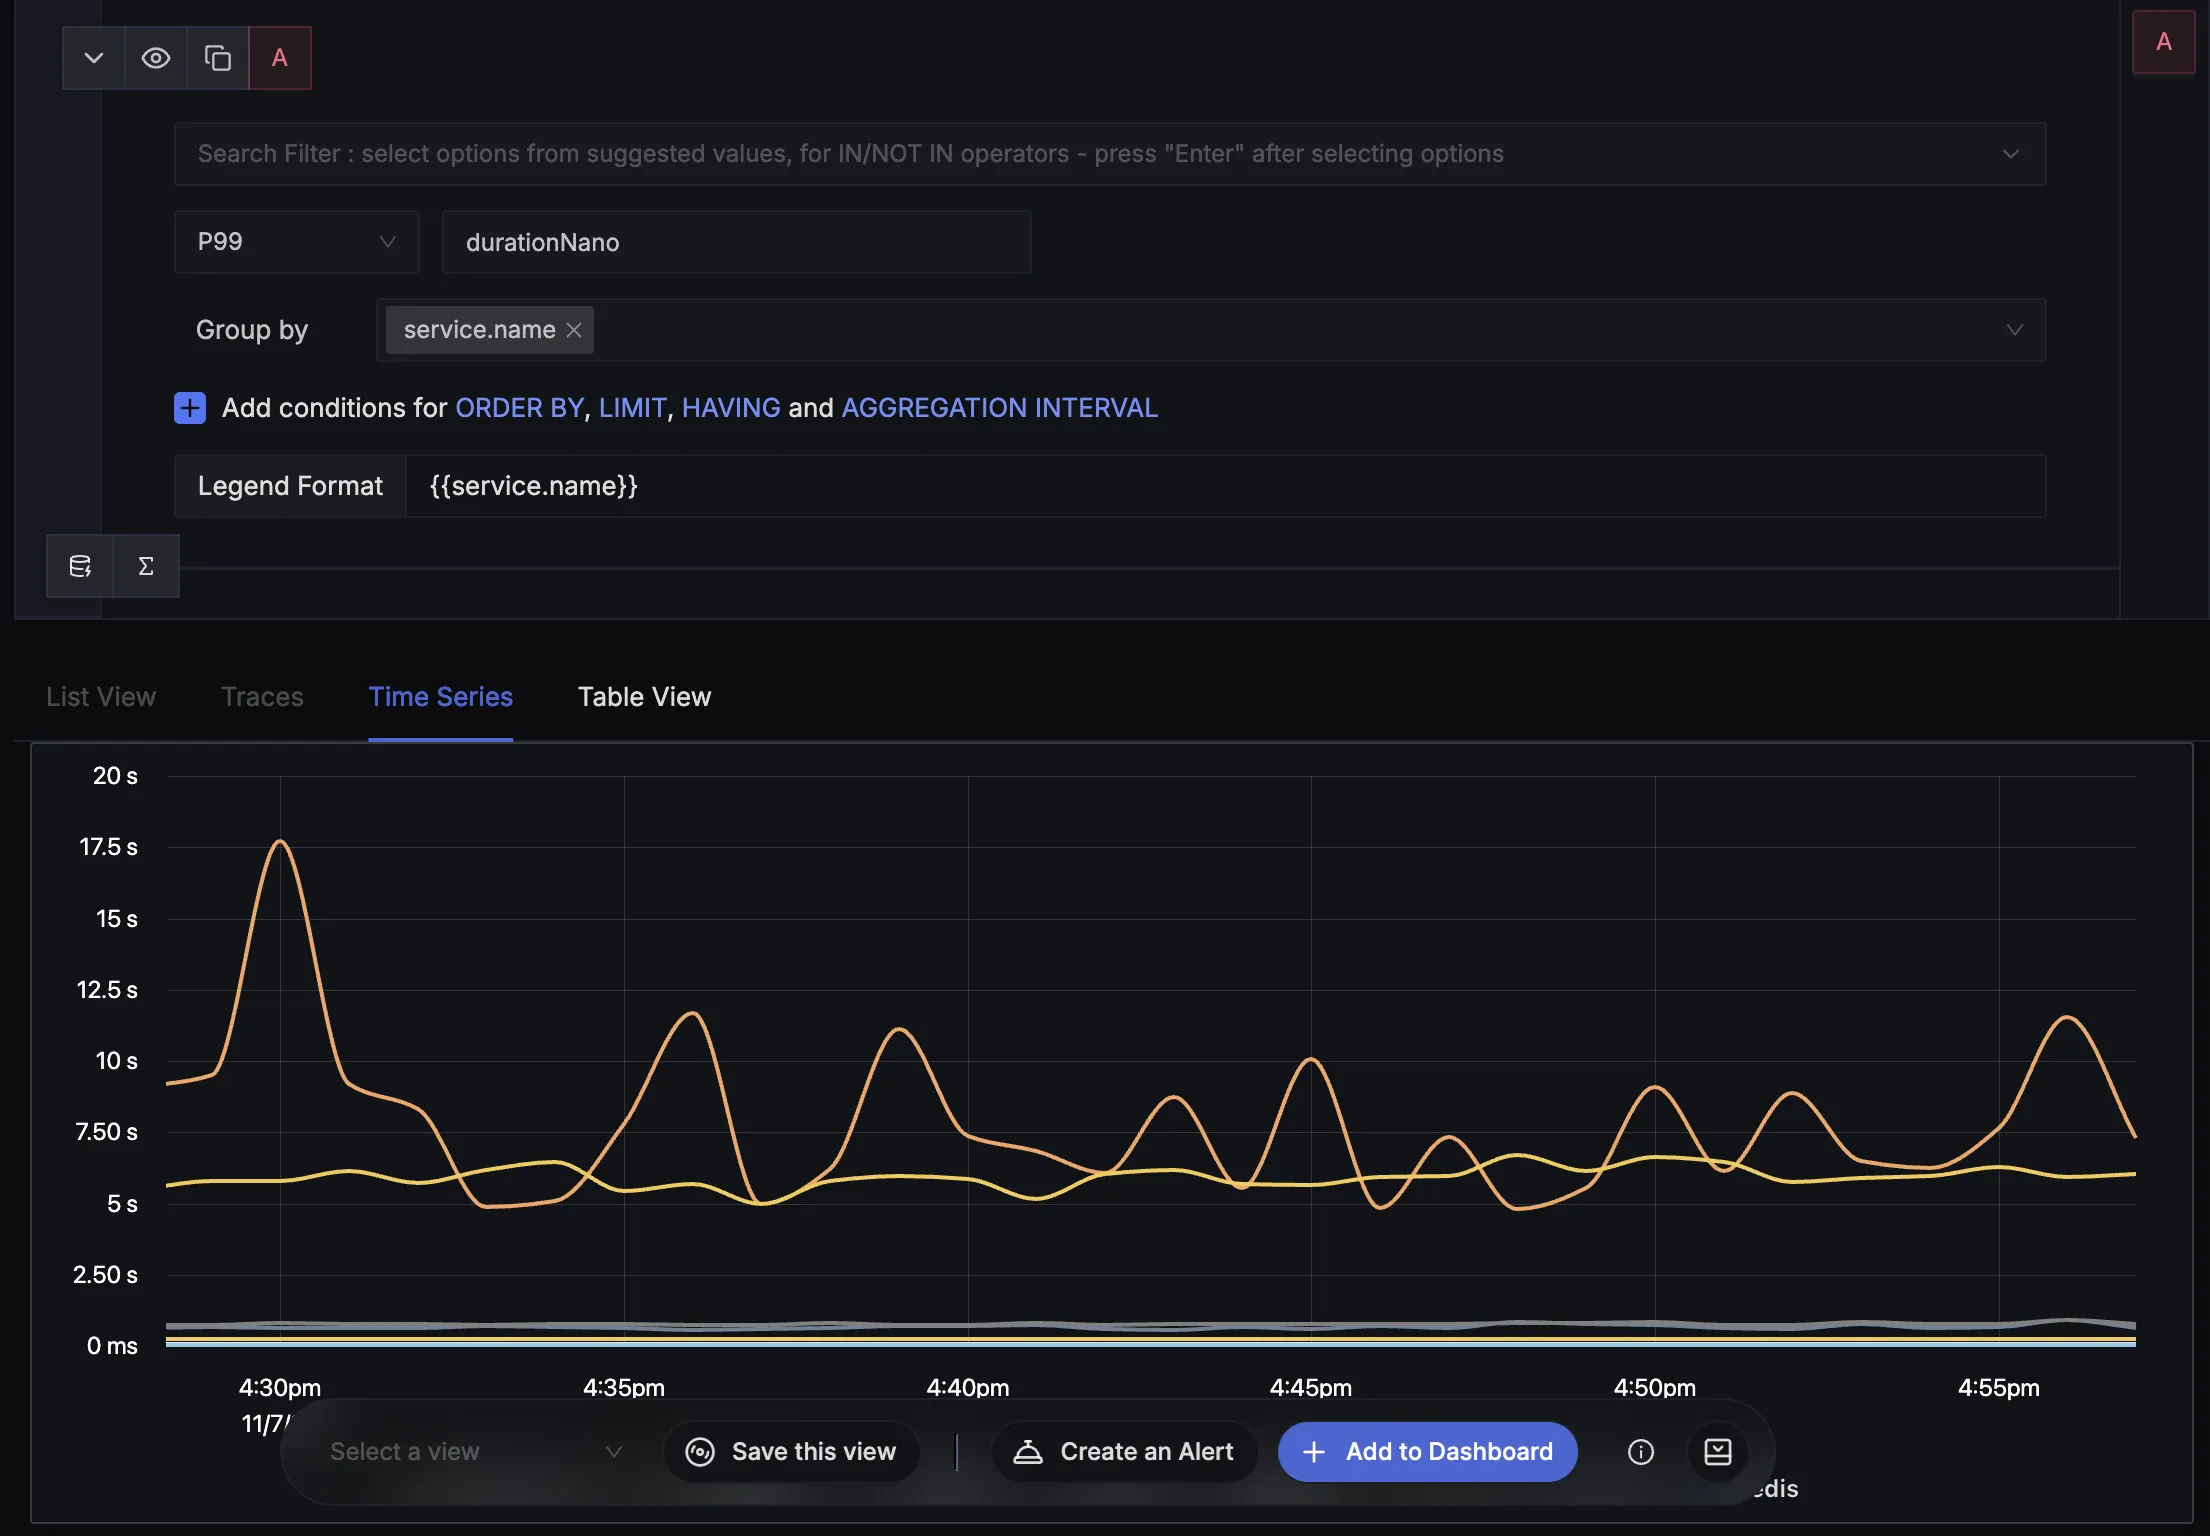
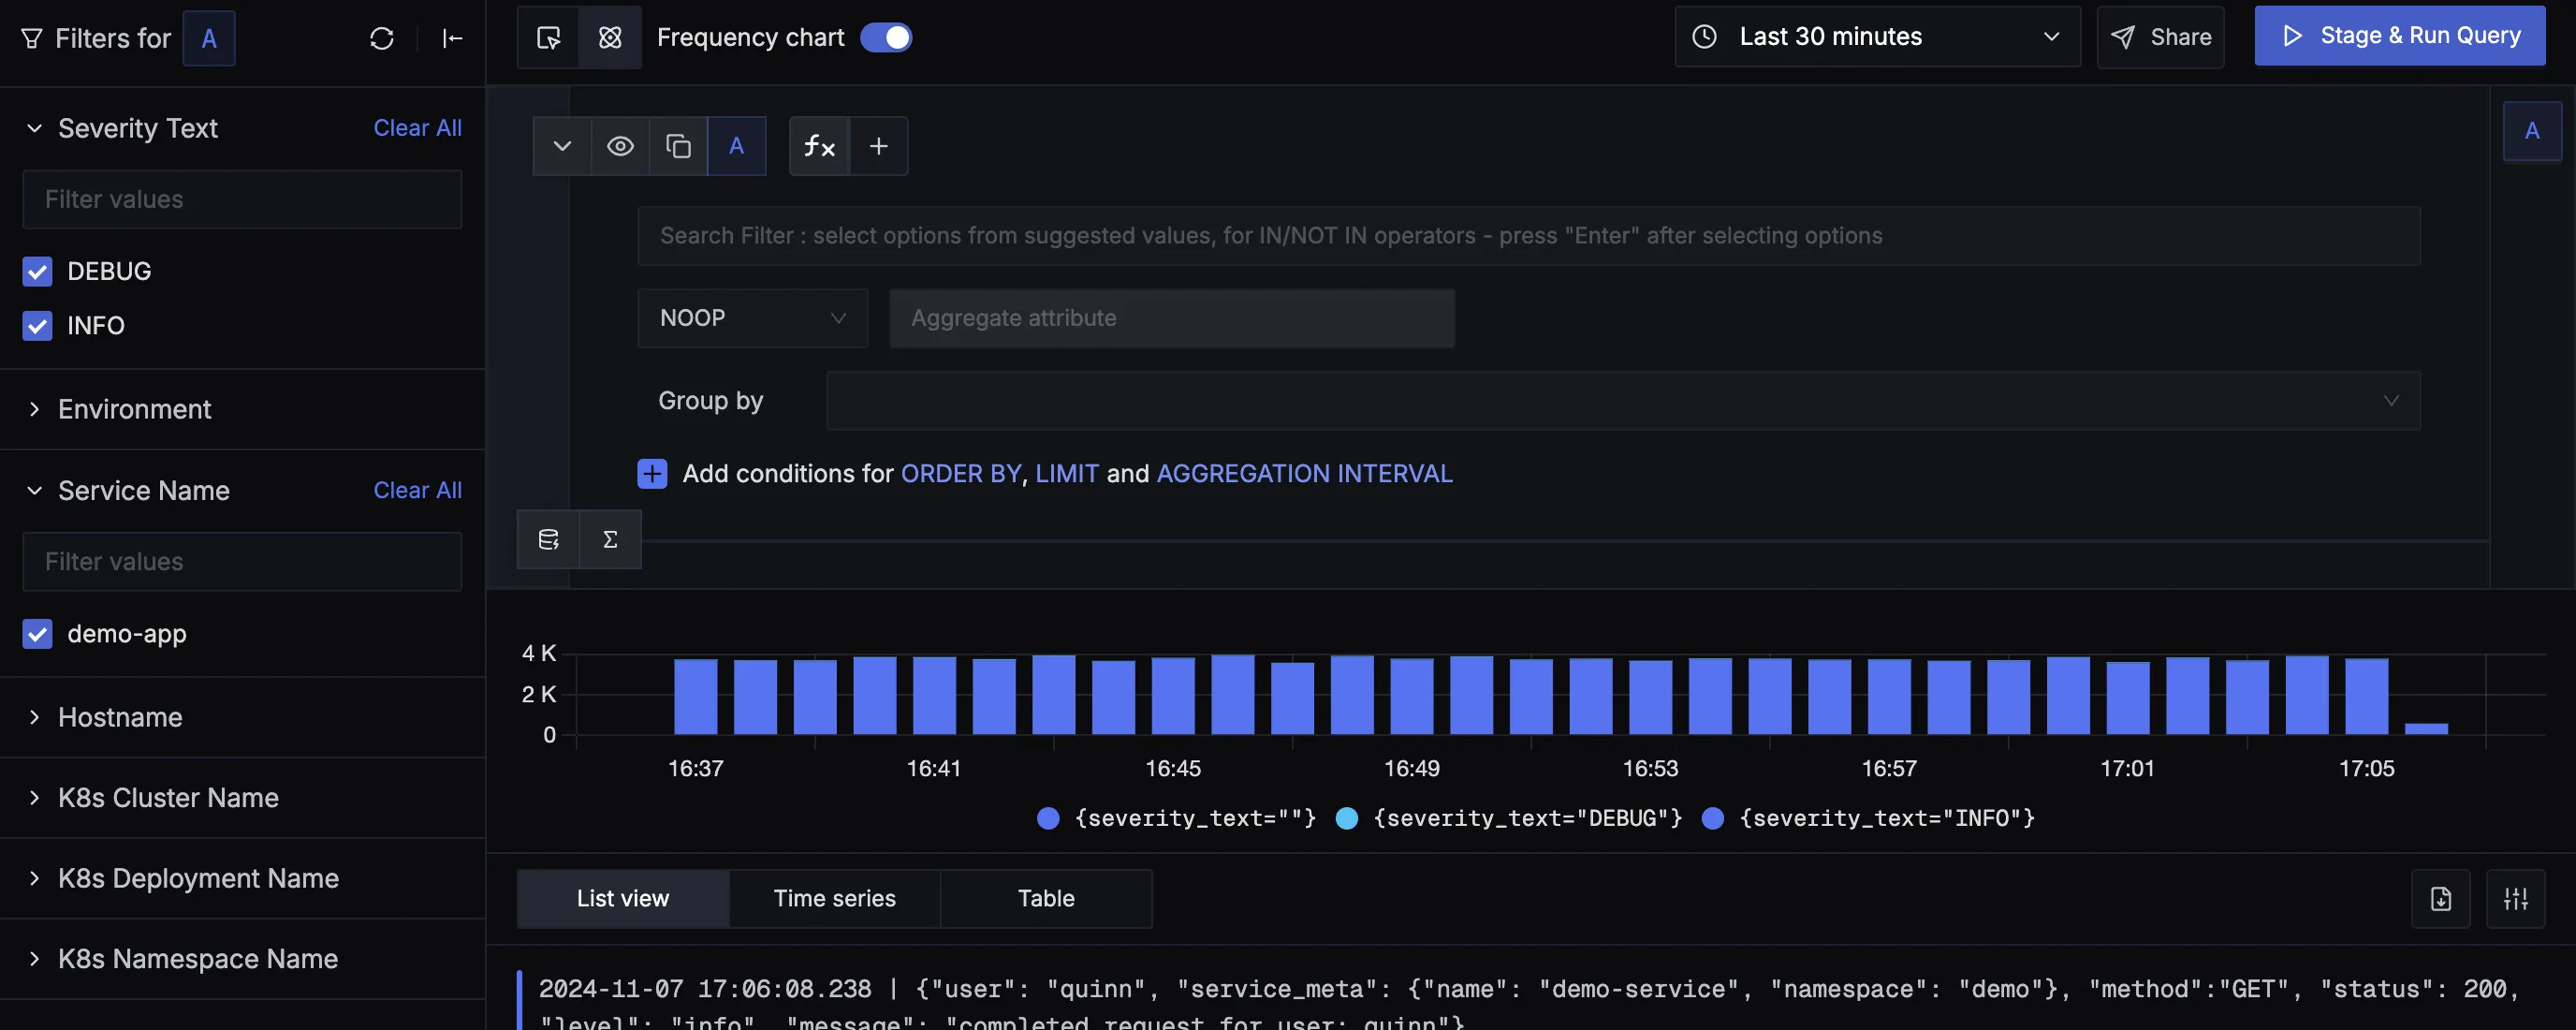
For all telemetry signals, there are quick filters to quickly filter out the data needed. We have built customized query builders for each signal to make your troublshooting work easier.
For example, query builder for traces allows you to create queries for finding the p99 latency of services.
Similarly, use quick filters to quickly filter the data that you need.
You can create custom metrics from filtered traces to find metrics of any type of request. Want to find p99 latency of customer_type: premium who are seeing status_code:400. Just set the filters, and you have the graph. Boom!
Flamegraphs & Gantt charts
Detailed flamegraph & Gantt charts to find the exact cause of the issue and which underlying requests are causing the problem. Is it a SQL query gone rogue or a Redis operation is causing an issue? Get more context on your spans with tags and events.

Logs Management
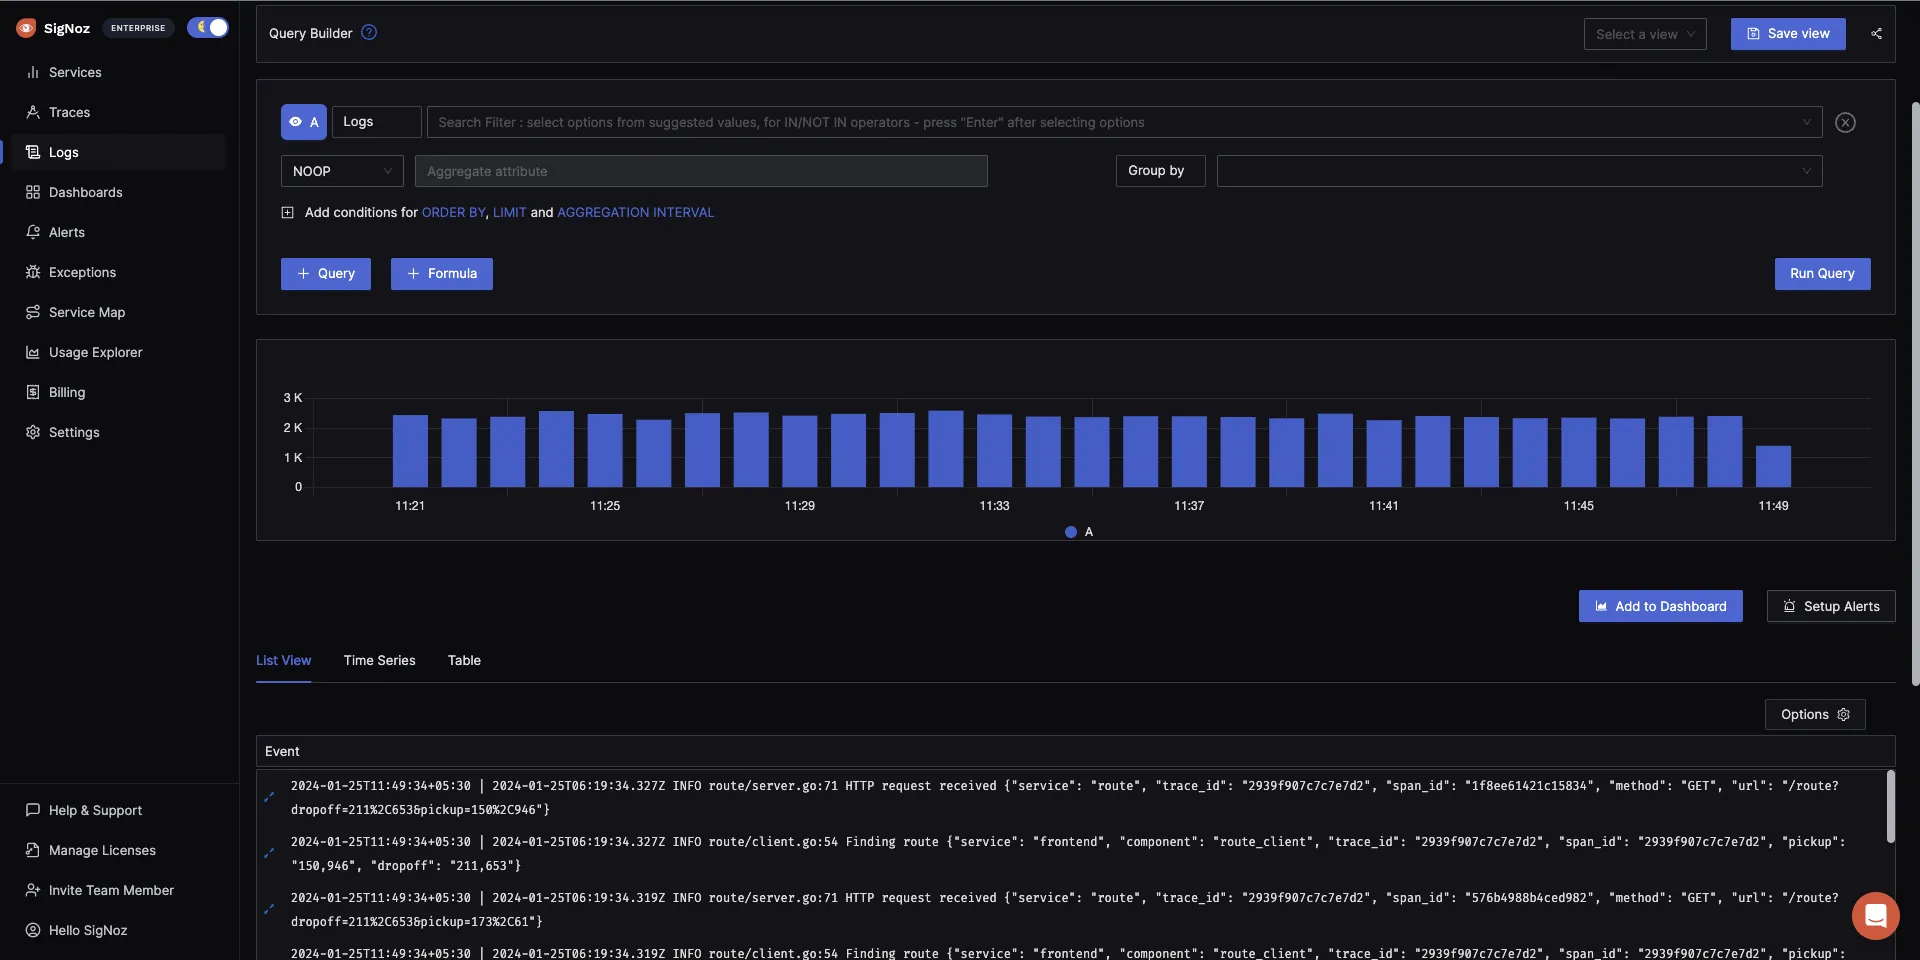
SigNoz provides Logs management with advanced log query builder. You can also monitor your logs in real-time using live tailing. SigNoz uses a columnar database ClickHouse to store logs, which is very efficient at ingesting and storing logs data. Columnar databases like ClickHouse are very effective in storing log data and making it available for analysis.
Metrics & Dashboards
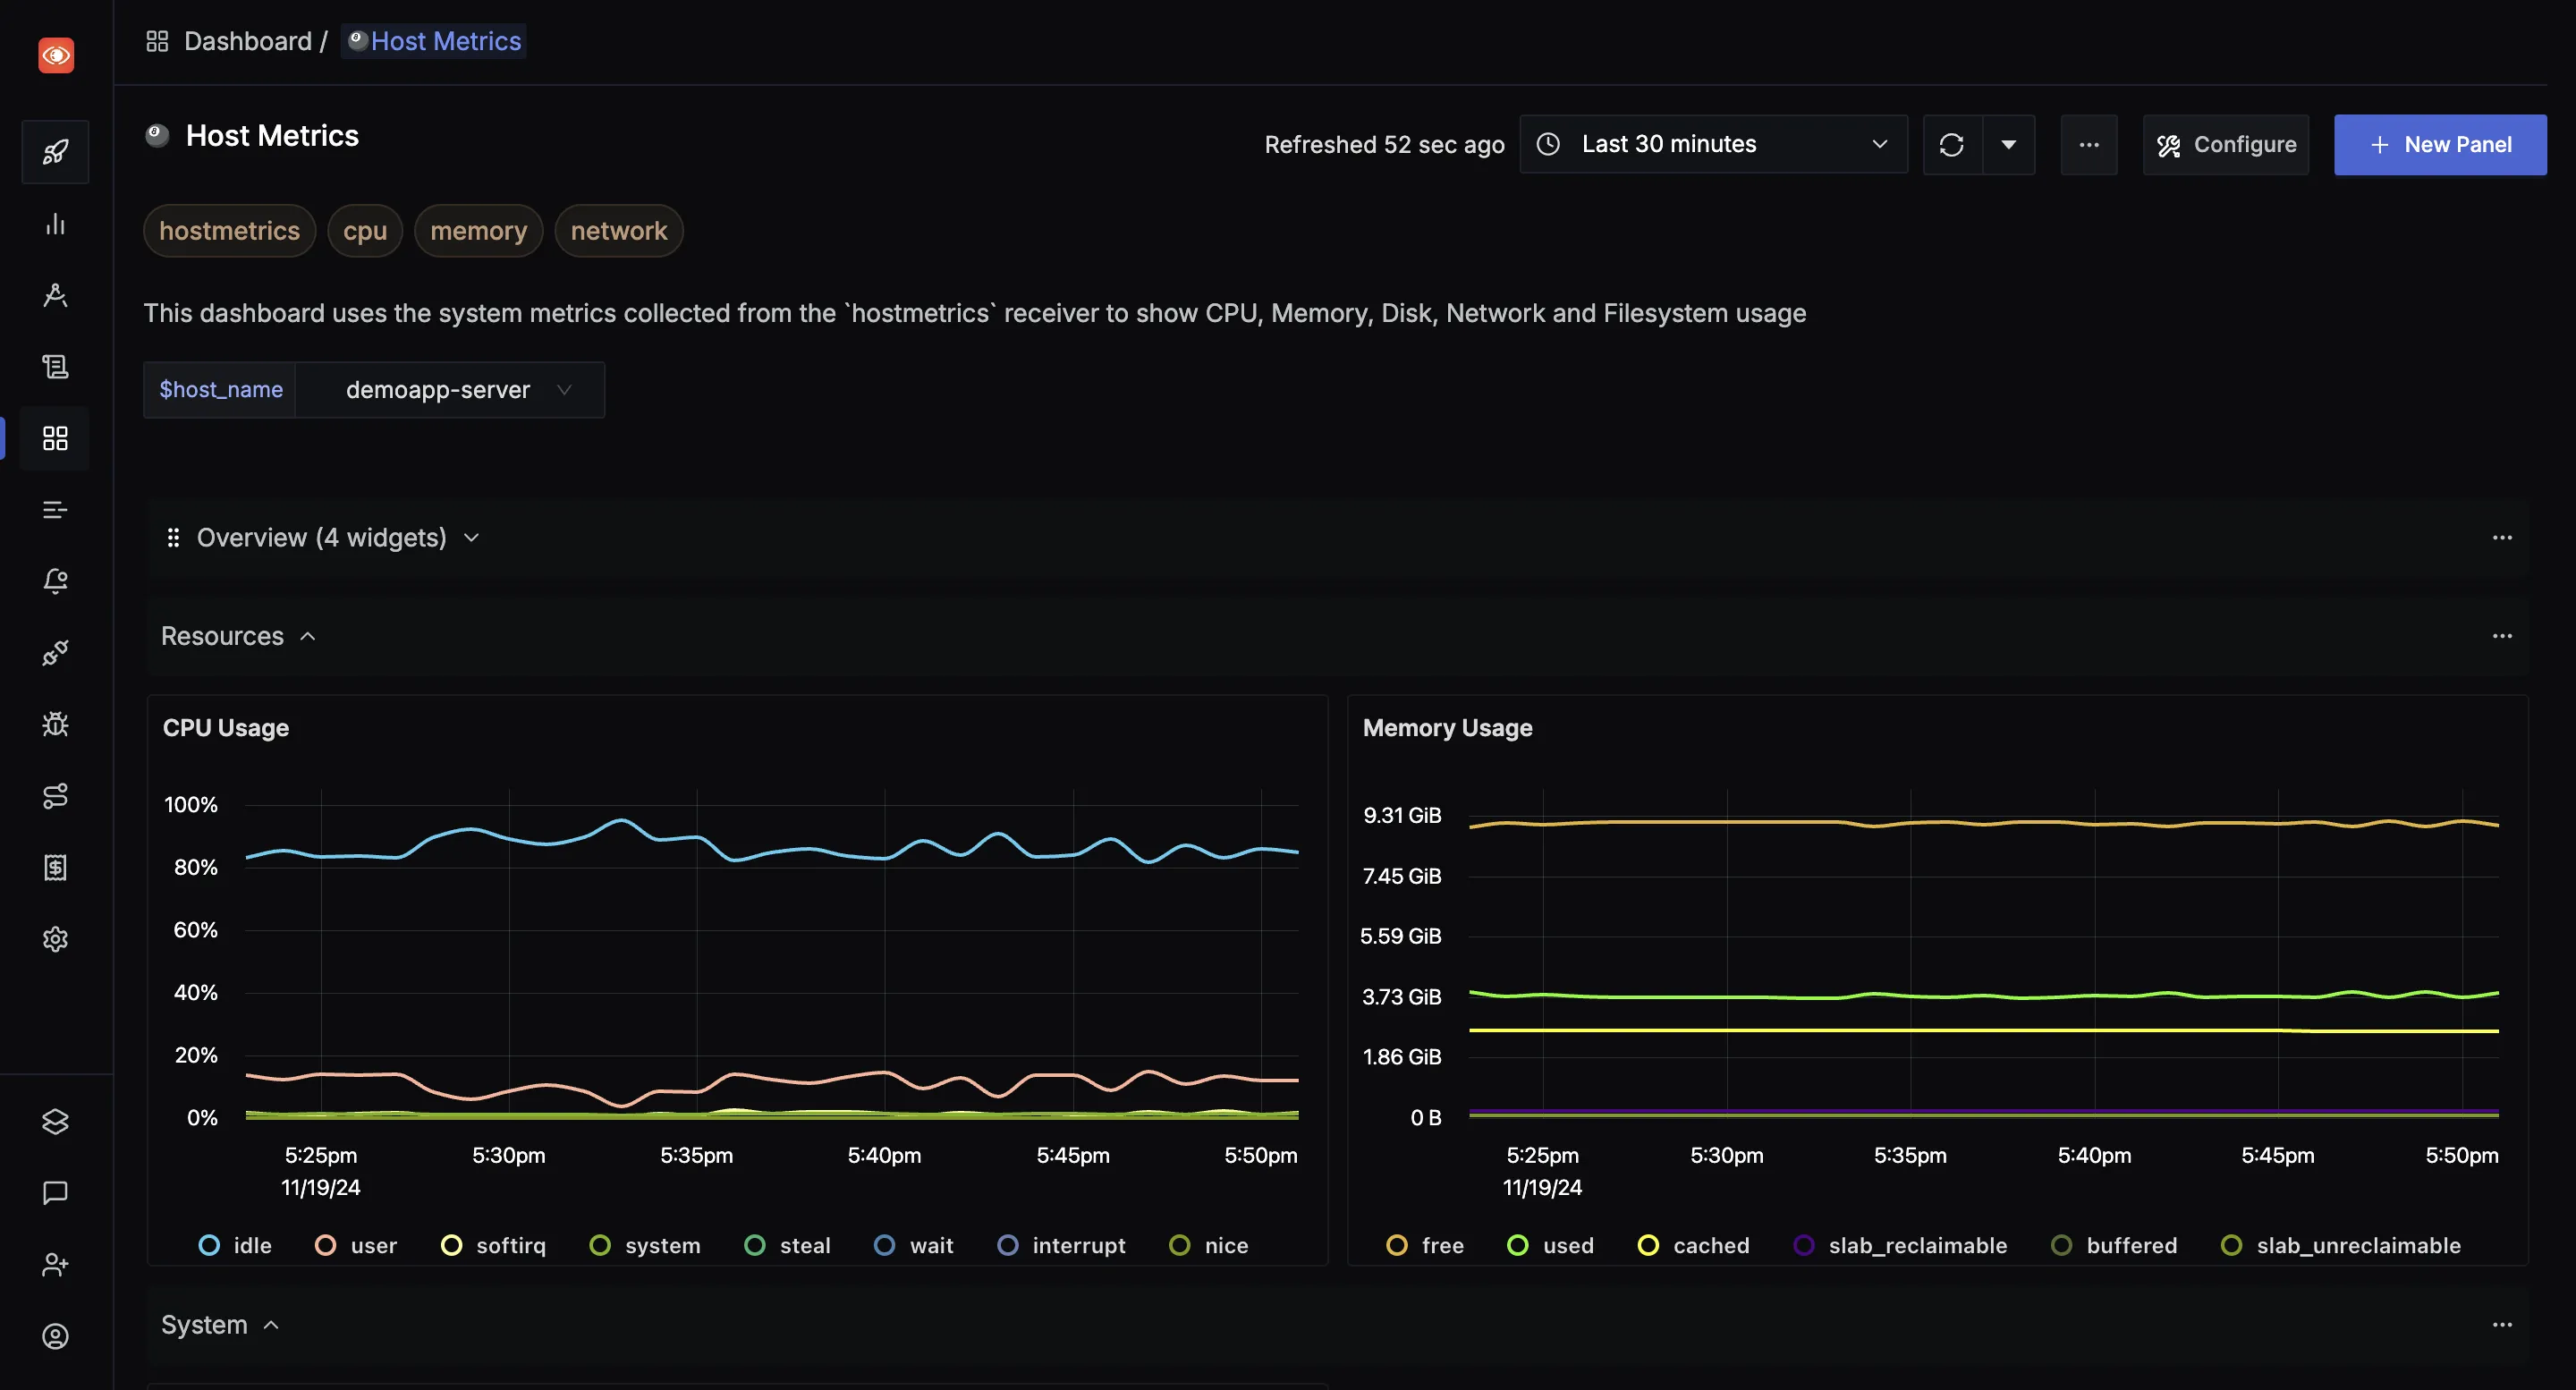
Monitor any metrics important to you. Ingest metrics from your infrastructure or applications and create customized dashboards to monitor them.
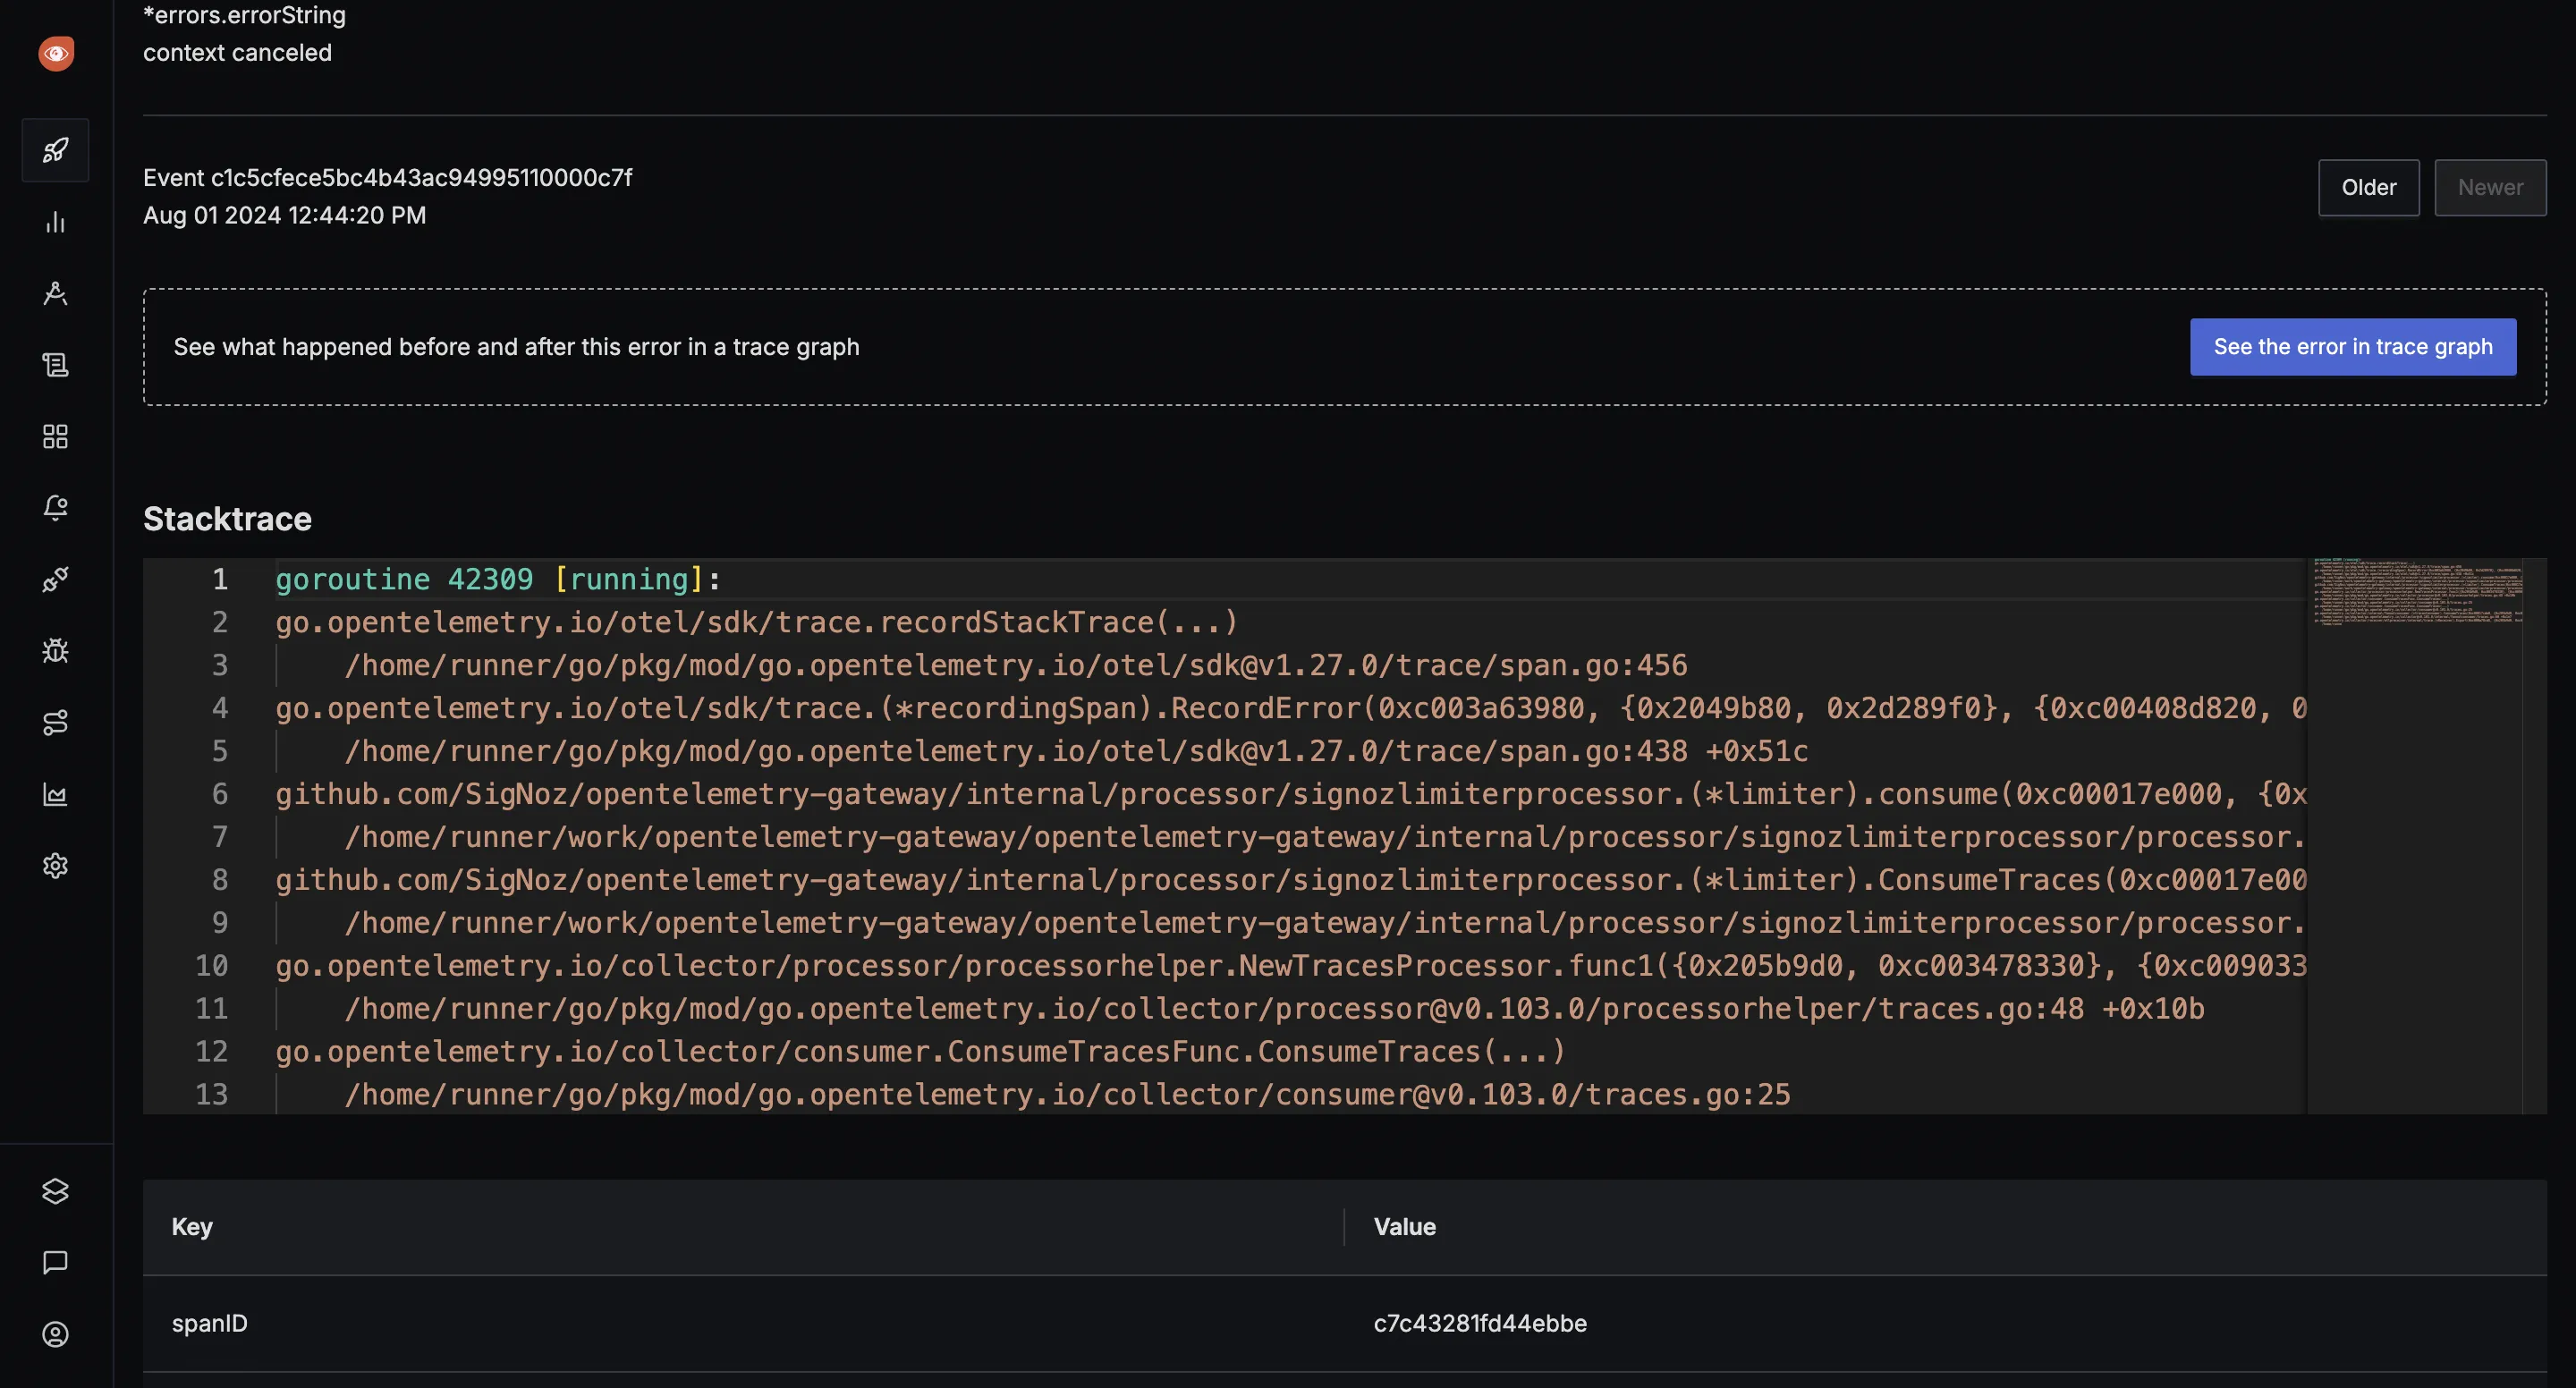
Exceptions Monitoring
Monitor exceptions automatically in Python, Java, Ruby, and Javascript. For other languages, just drop in a few lines of code and start monitoring exceptions.
Simple usage-based pricing with cost control features
Open-source SigNoz is free to self-host and use. SigNoz cloud is the easiest way of running SigNoz without any hassle of maintenance. For cloud, we have a simple usage-based pricing based on amount of data sent.
- Logs: $0.3/GB ingested
- Traces: $0.3/GB ingested
- Metrics: $0.1/mil samples
Check out our pricing plans for more details. You can also estimate your monthly bill using the pricing calculator.
Getting started with SigNoz
SigNoz cloud is the easiest way to run SigNoz. Sign up for a free account and get 30 days of unlimited access to all features.
You can also install and self-host SigNoz yourself since it is open-source. With 19,000+ GitHub stars, open-source SigNoz is loved by developers. Find the instructions to self-host SigNoz.
SigNoz vs New Relic Comparison Table
| Feature | SigNoz | New Relic |
|---|---|---|
| Type | Open-source | Proprietary SaaS |
| Pricing | Free (self-hosted) | Tiered pricing plans |
| Installation | On-premise or cloud | Cloud-only |
| Data Privacy | Data stays within your infrastructure | Data stored on New Relic servers |
| Customization | Fully customizable | Limited to available features |
| OpenTelemetry Support | Native support | Supported |
| User Interface | Modern, unified UI for metrics, traces, and logs | Comprehensive but can be complex |
| Learning Curve | Moderate | Steep |
| Community Support | Growing open-source community | Large established community |
| Enterprise Support | Community-driven | 24/7 professional support |
| Scalability | Highly scalable (depends on your infrastructure) | Highly scalable |
| Integration Ecosystem | Growing, focuses on open standards | Extensive |
| Alerting | Customizable alerting with query builder | Advanced alerting capabilities |
| APM Features | Full-stack observability | Full-stack observability |
| Log Management | Integrated log management | Integrated log management |
| Infrastructure Monitoring | Supported | Supported |
| Distributed Tracing | Supported | Supported |
| Custom Dashboards | Fully customizable | Customizable with some limitations |
Note: Features and pricing may change over time. Always check the official websites for the most up-to-date information.
FAQs
What is the New Relic equivalent open-source?
SigNoz is an excellent open-source alternative to New Relic. It provides similar functionality for application performance monitoring and observability, with the added benefits of being open-source, such as transparency, extensibility, and on-premise installation options.
Is SigNoz open-source?
Yes, SigNoz is fully open-source. Its codebase is publicly available, allowing developers to inspect, modify, and contribute to the project. This transparency is one of the key advantages SigNoz offers over proprietary solutions like New Relic.
What are the key features of SigNoz as a New Relic alternative?
SigNoz offers several key features that make it a strong alternative to New Relic:
- Unified UI for metrics, traces, and logs
- Out-of-the-box application metrics
- Seamless flow between metrics, traces, and logs
- Advanced filtering and tagging capabilities
- Custom aggregates on trace data
- Detailed flamegraphs and Gantt charts
- Native support for OpenTelemetry
- Transparent usage data
How does SigNoz compare to New Relic in terms of pricing?
While New Relic is a paid SaaS product with various pricing tiers, SigNoz is completely free and open-source. This means you can deploy SigNoz on your own infrastructure without ongoing subscription costs. However, keep in mind that you'll need to manage the infrastructure and maintenance yourself.
Does SigNoz support OpenTelemetry like New Relic?
Yes, SigNoz is built to support OpenTelemetry natively. This is a significant advantage as OpenTelemetry is becoming the world standard for generating and managing telemetry data in cloud-native applications. New Relic also supports OpenTelemetry, but SigNoz's native support may offer better integration and performance.
Can SigNoz be installed on-premises unlike New Relic?
Yes, one of the key advantages of SigNoz over New Relic is that it can be installed on-premises. This is particularly beneficial for companies with strict data privacy policies or those that prefer to keep their monitoring data within their own infrastructure.
How does SigNoz handle logs compared to New Relic?
SigNoz provides comprehensive logs management capabilities, including an advanced log query builder and live tailing for real-time log monitoring. This functionality is comparable to New Relic's logging features, but with the added benefit of being part of an open-source, self-hosted solution.
Is SigNoz suitable for monitoring microservices architectures like New Relic?
Absolutely. SigNoz is designed to handle distributed systems and microservices architectures. It provides the necessary tools to track user requests across multiple services, making it well-suited for modern, complex application environments, similar to New Relic's capabilities in this area.
Related Content


