Angular applications often grow in complexity, making it challenging to monitor performance and troubleshoot issues effectively. Enter OpenTelemetry: a powerful, vendor-neutral framework for distributed tracing and metrics collection. This guide will walk you through implementing OpenTelemetry in your Angular projects, enhancing your ability to observe and optimize your applications.
What is OpenTelemetry and Why Use it in Angular?
OpenTelemetry is an open-source vendor-agnostic set of tools, APIs, and SDKs used to instrument applications to create and manage telemetry data(logs, metrics, and traces). It aims to make telemetry data(logs, metrics, and traces) a built-in feature of cloud-native software applications.
The telemetry data is then sent to an observability tool for storage and visualization.
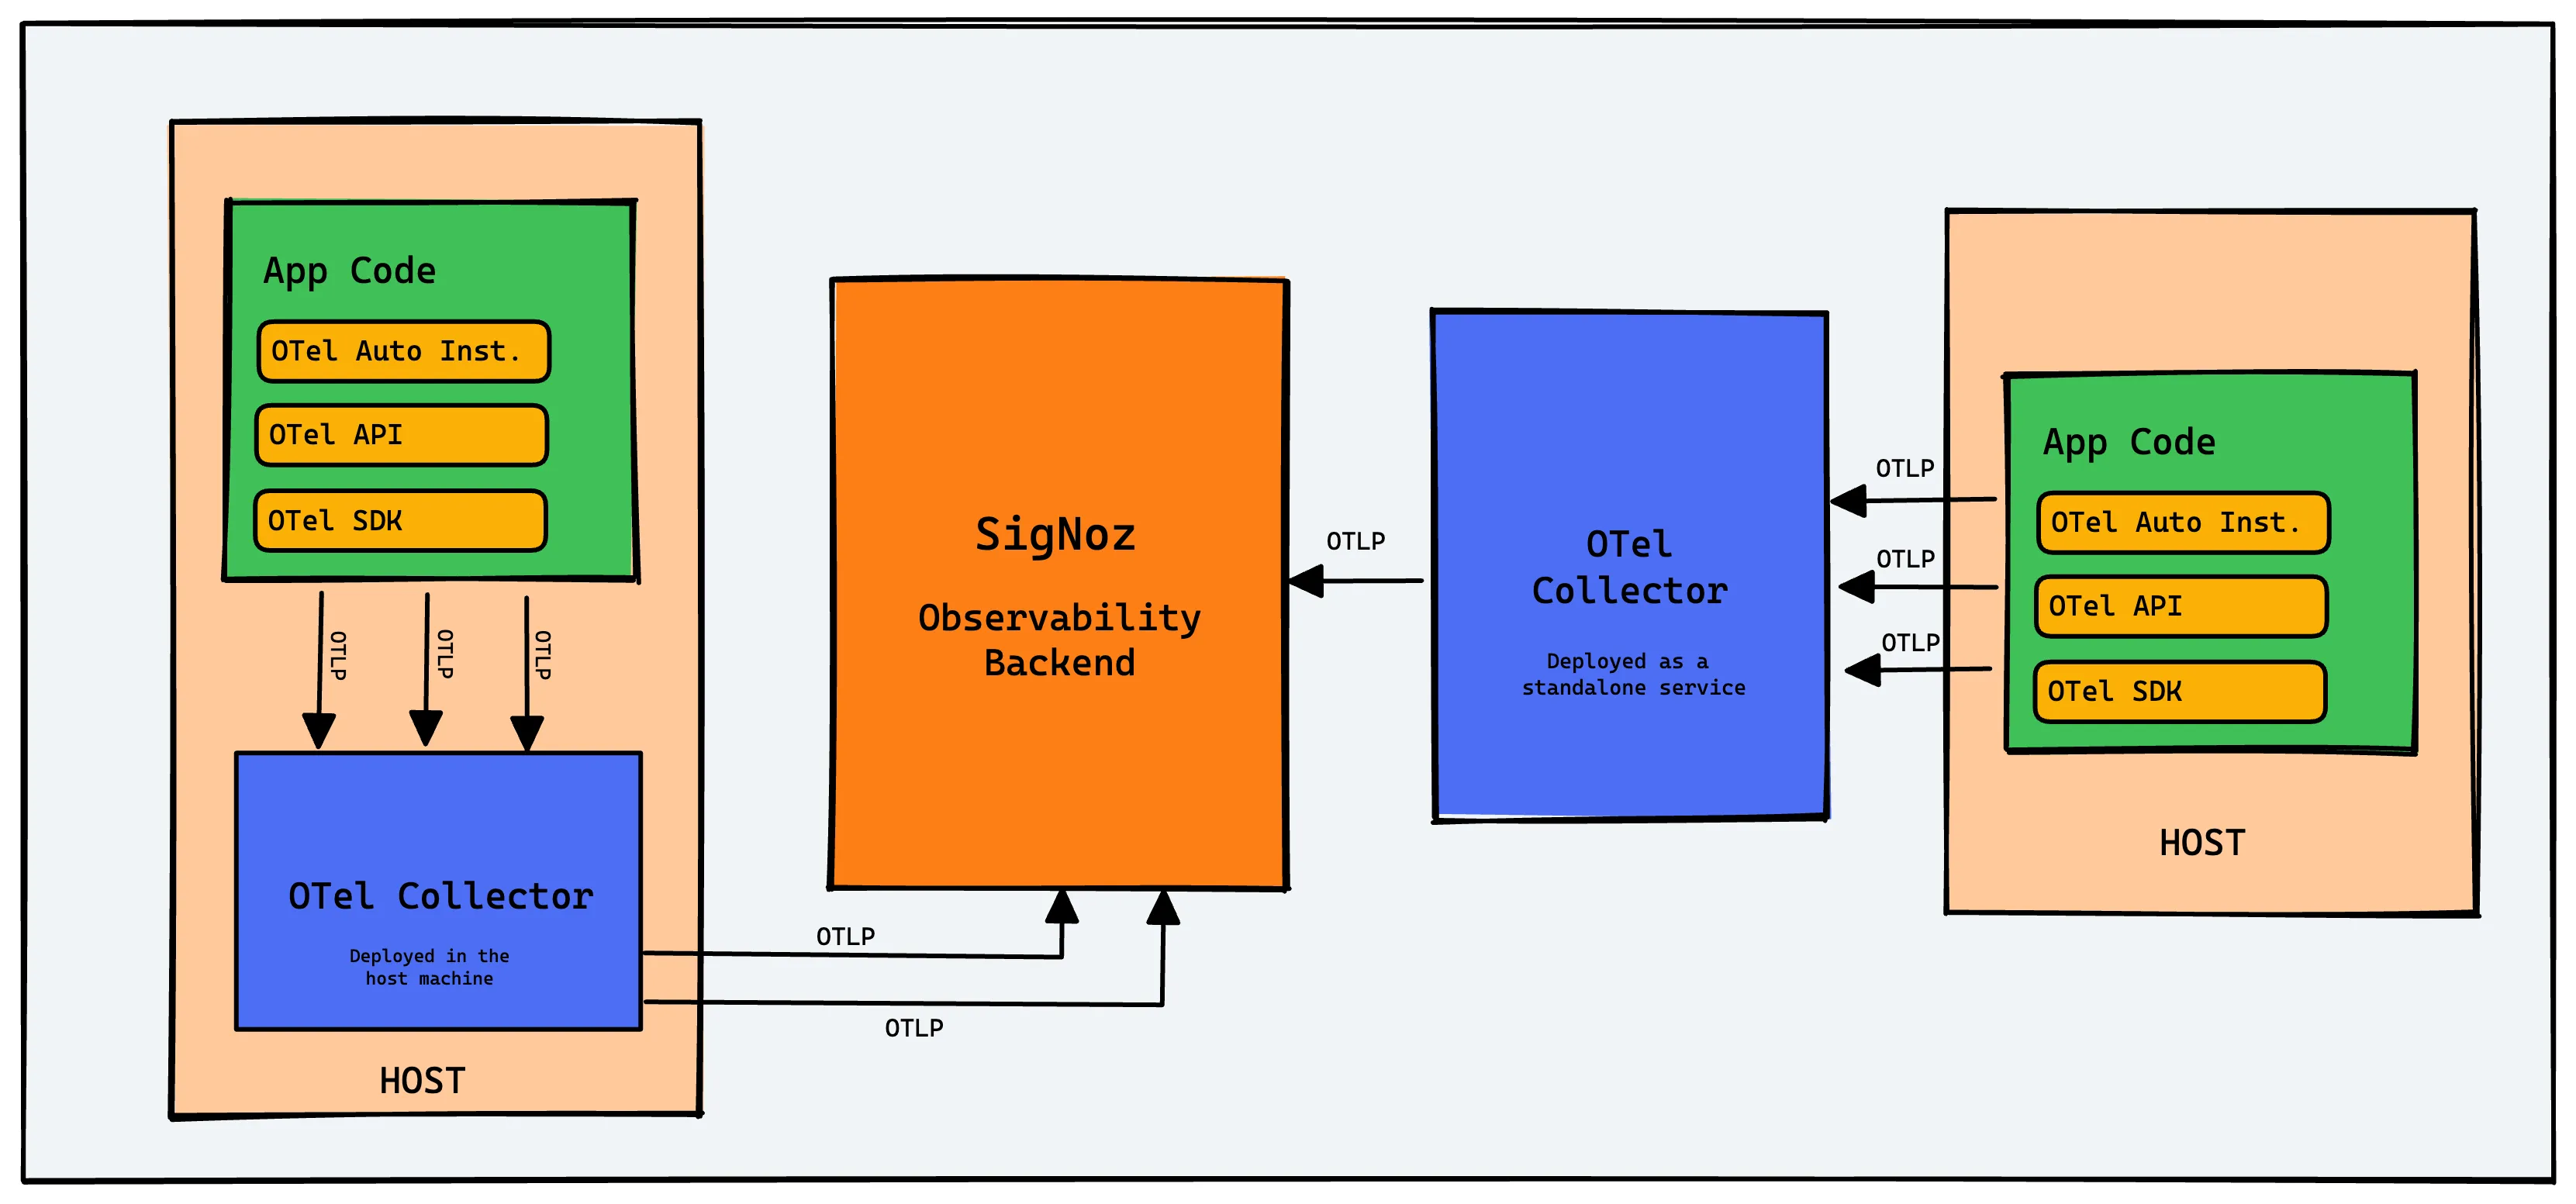
OpenTelemetry is the bedrock for setting up an observability framework. It also provides you the freedom to choose a backend analysis tool of your choice.
Why should you consider using OpenTelemetry in your Angular applications?
- Comprehensive insights: OpenTelemetry offers a holistic view of your application's performance, covering both frontend and backend operations.
- Standardization: It provides a unified approach to instrumentation across different languages and frameworks.
- Flexibility: OpenTelemetry is vendor-neutral, allowing you to switch between different monitoring backends without changing your instrumentation code.
- Future-proofing: As an industry-standard solution, OpenTelemetry ensures your observability strategy remains relevant and adaptable.
Compared to traditional monitoring solutions, OpenTelemetry offers greater flexibility and depth of insights. It allows you to trace requests across your entire stack, providing a more comprehensive understanding of your application's behavior.
OpenTelemetry and SigNoz
In this article, we will use SigNoz as our backend analysis tool. SigNoz is a full-stack open-source APM tool that can be used for storing and visualizing the telemetry data collected with OpenTelemetry. It is built natively on OpenTelemetry and supports OTLP data formats.
SigNoz provides query and visualization capabilities for the end-user and comes with out-of-box charts for application metrics and traces. SigNoz also provides logs management with advanced logs query builder and live tailing. With metrics, traces, and logs under a single pane of glass, SigNoz can be a one-stop open source observability platform.
Now let’s get down to how to implement OpenTelemetry Angular libraries and then visualize the collected data in SigNoz.
Running Angular application with OpenTelemetry
Step 1: Install SigNoz
First, you need to install SigNoz so that OpenTelemetry can send the data to it.
SigNoz can be installed on macOS or Linux computers in just three steps by using a simple install script.
The install script automatically installs Docker Engine on Linux. However, on macOS, you must manually install Docker Engine before running the install script.
git clone -b main <https://github.com/SigNoz/signoz.git>
cd signoz/deploy/
./install.sh
You can visit our documentation for instructions on how to install SigNoz using Docker Swarm and Helm Charts.

When you are done installing SigNoz, you can access the UI at http://localhost:3301
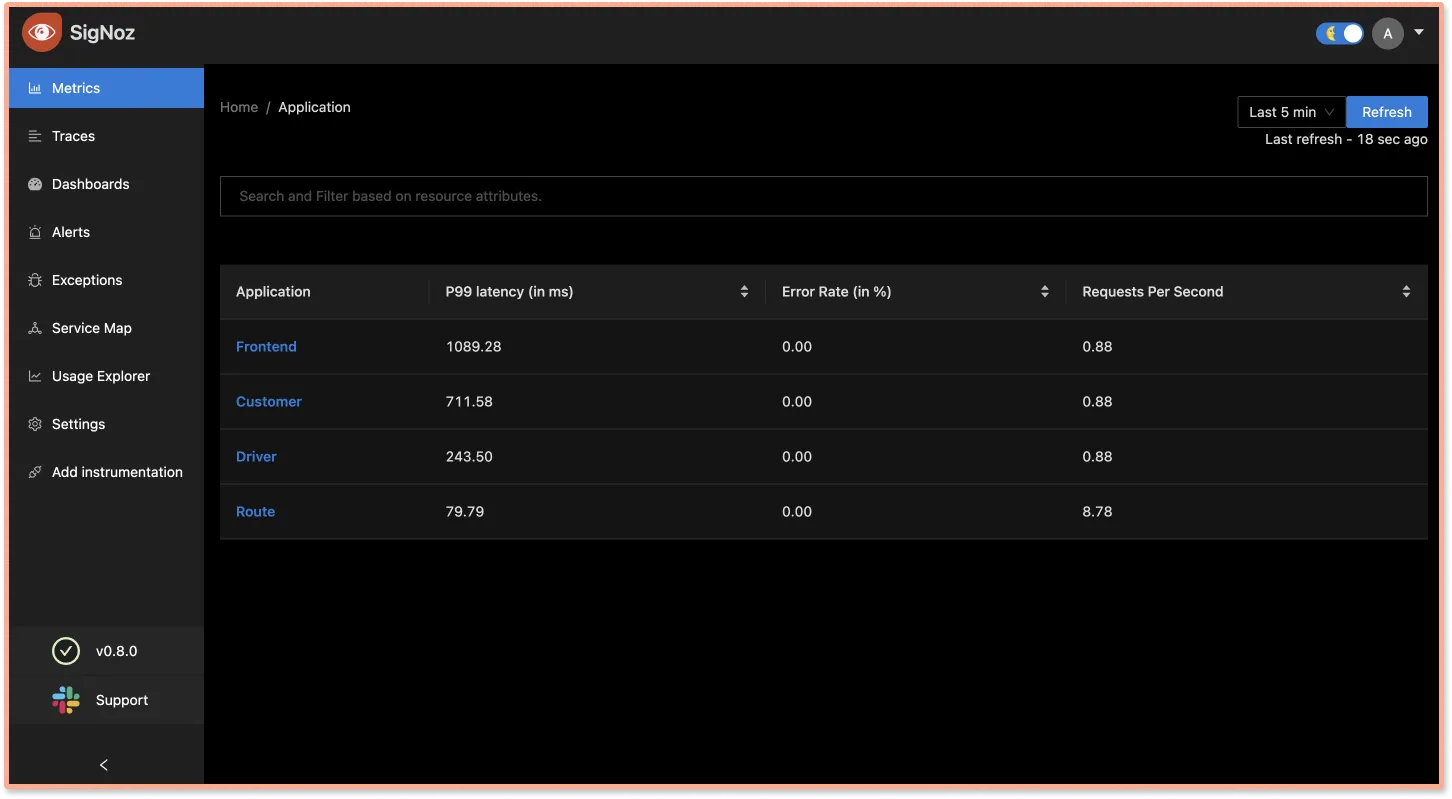
Step 2: Get sample Angular app
We have set up two sample GitHub repos in order to demonstrate the example at hand
- Sample Angular App
It contains the sample boilerplate code that we will instrument. If you want to follow the tutorial, then you should follow thewithout instrumentationbranch. - Sample Nodejs App
It contains a basic backend API which we will be calling. The backend API is also instrumented with OpenTelemetry to have end-to-end tracing.
Step 3: Enable CORS in the OTel Receiver
Enable CORS in the OTel Receiver. Under SigNoz folder, open the otel-collector-config.yaml file. The file is located at deploy/docker/clickhouse-setup/otel-collector-config.yaml
You can view the file at SigNoz GitHub repo. Inside the file add the following CORS config:
http:
+        cors:
+          allowed_origins:
+            - <https://netflix.com>  # URL of your Frontend application
You need to update the URL of your frontend application. For this tutorial, we will be running our frontend application on http://localhost:4200.
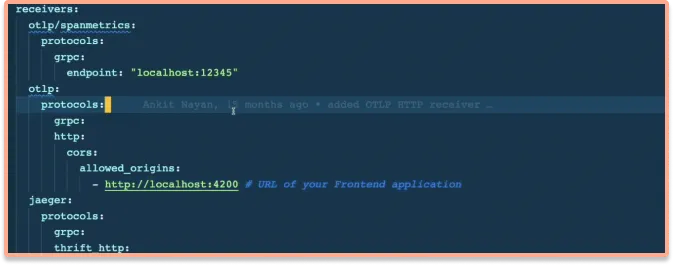
Once you make the changes, you need to restart the Docker containers.
Step 4: Instrument Angular app with OpenTelemetry
To instrument the angular app with OpenTelemetry, we need to install the OpenTelemetry dependencies.
npm i @jufab/opentelemetry-angular-interceptor && npm i @opentelemetry/api @opentelemetry/sdk-trace-web @opentelemetry/sdk-trace-base @opentelemetry/core @opentelemetry/semantic-conventions @opentelemetry/resources @opentelemetry/exporter-trace-otlp-http @opentelemetry/exporter-zipkin @opentelemetry/propagator-b3 @opentelemetry/propagator-jaeger @opentelemetry/context-zone-peer-dep @opentelemetry/instrumentation @opentelemetry/instrumentation-document-load @opentelemetry/instrumentation-fetch @opentelemetry/instrumentation-xml-http-request @opentelemetry/propagator-aws-xray --save-dev
Step 5: Update app.module.ts file
import {
  OpenTelemetryInterceptorModule,
  OtelColExporterModule,
  CompositePropagatorModule,
} from '@jufab/opentelemetry-angular-interceptor';

@NgModule({
  ...
  imports: [
    ...
    OpenTelemetryInterceptorModule.forRoot({
      commonConfig: {
        console: true, // Display trace on console (only in DEV env)
        production: false, // Send Trace with BatchSpanProcessor (true) or SimpleSpanProcessor (false)
        serviceName: 'Angular Sample App', // Service name send in trace
        probabilitySampler: '1',
      },
      otelcolConfig: {
        url: '<http://127.0.0.1:4318/v1/traces>', // URL of opentelemetry collector
      },
    }),
    //Insert OtelCol exporter module
    OtelColExporterModule,
    //Insert propagator module
    CompositePropagatorModule,
  ],
  ...
})
Make sure to update then URL of OpenTelemetry Collector under otelcolConfig. In our case since we’re running SigNoz in local, the URL is http://127.0.0.1:4318/v1/traces.
You can change the name of the service, and other configurations under commonConfig.
Step 6: Start the angular app and the backend API
For Angular app:
Go to the root folder of your Angular application, and run the following command:
yarn start
For backend API:
Install the dependencies
yarn install
If SigNoz is installed locally, run your backend API using:
yarn run start:local
If SigNoz is not installed locally, then you would need to set the IP of the machine where SigNoz is installed. You can do so by using the below command:
OTEL_EXPORTER_OTLP_ENDPOINT="<IP of SigNoz>:4317" OTEL_RESOURCE_ATTRIBUTES=service.name=NAME_OF_SERVICE yarn run start:custom```
Congratulations! You have successfully run your Angular application with OpenTelemetry. It’s time to see the collected data.
Step 7: Generate some data
In order to monitor your Angular application with SigNoz, you first need to generate some data.
Visit http://localhost:4200/ to access your frontend application. Using the UI, make some calls to the backend API. You can check the network tab in your browser to see the requests that you have made.
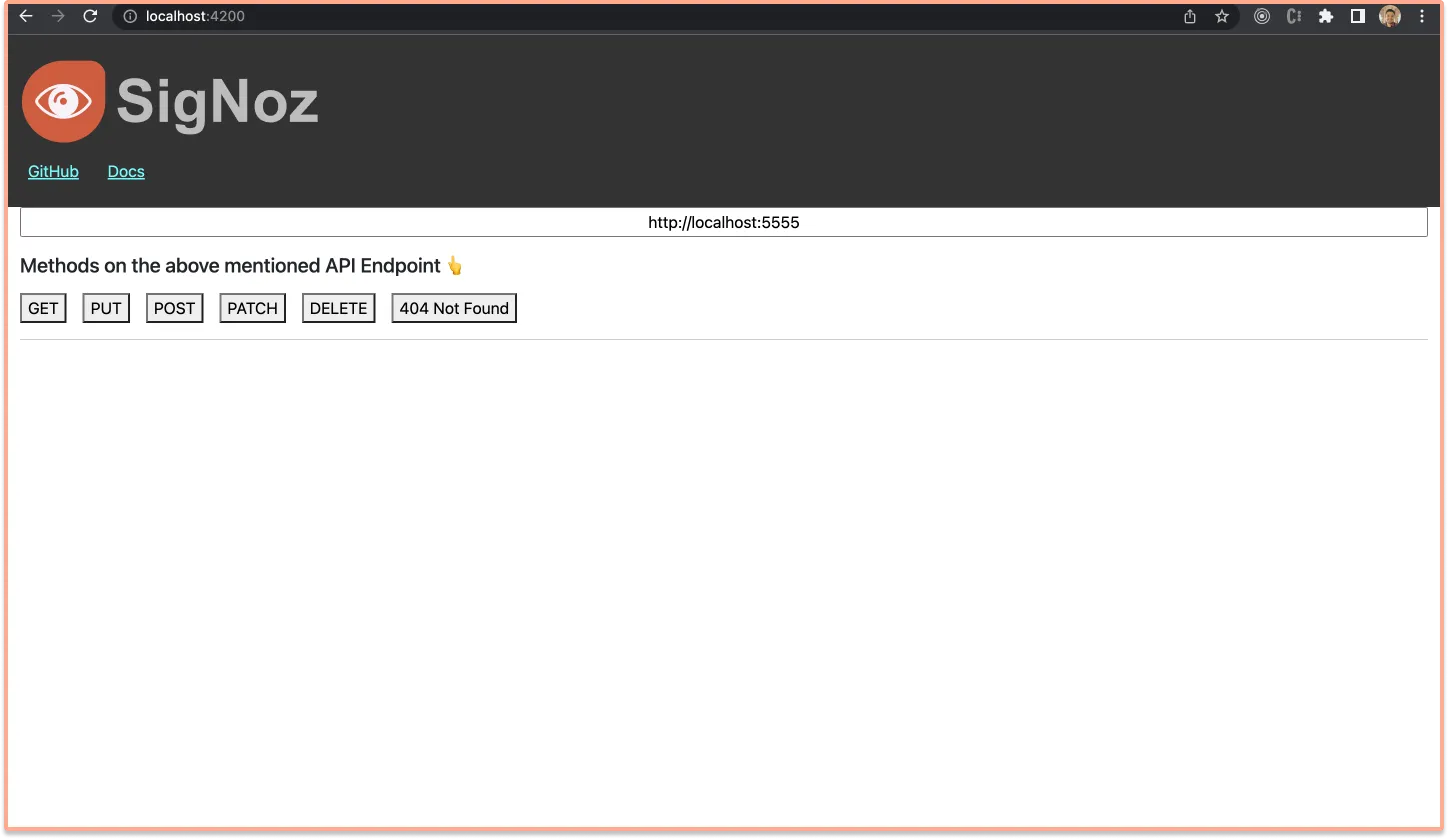
Step 8: Monitor your application with SigNoz
With SigNoz you can monitor the data collected by OpenTelemetry from your sample Angular application. You can see end-to-end traces for your Angular application, starting from your frontend application to the downstream nodejs-sample-app.
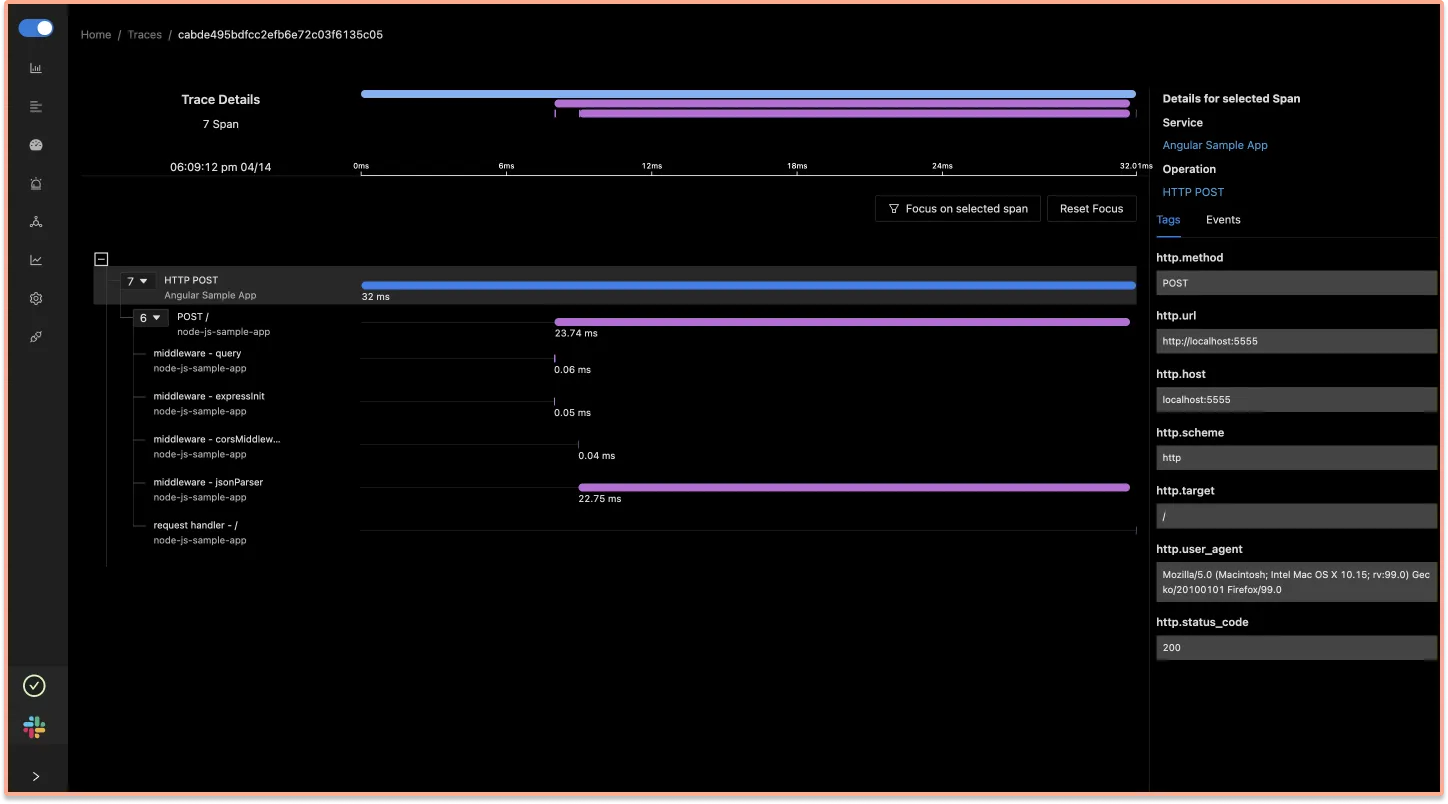
You can also monitor errors that takes place in your Angular application. SigNoz UI also shows attributes like http_status_code .
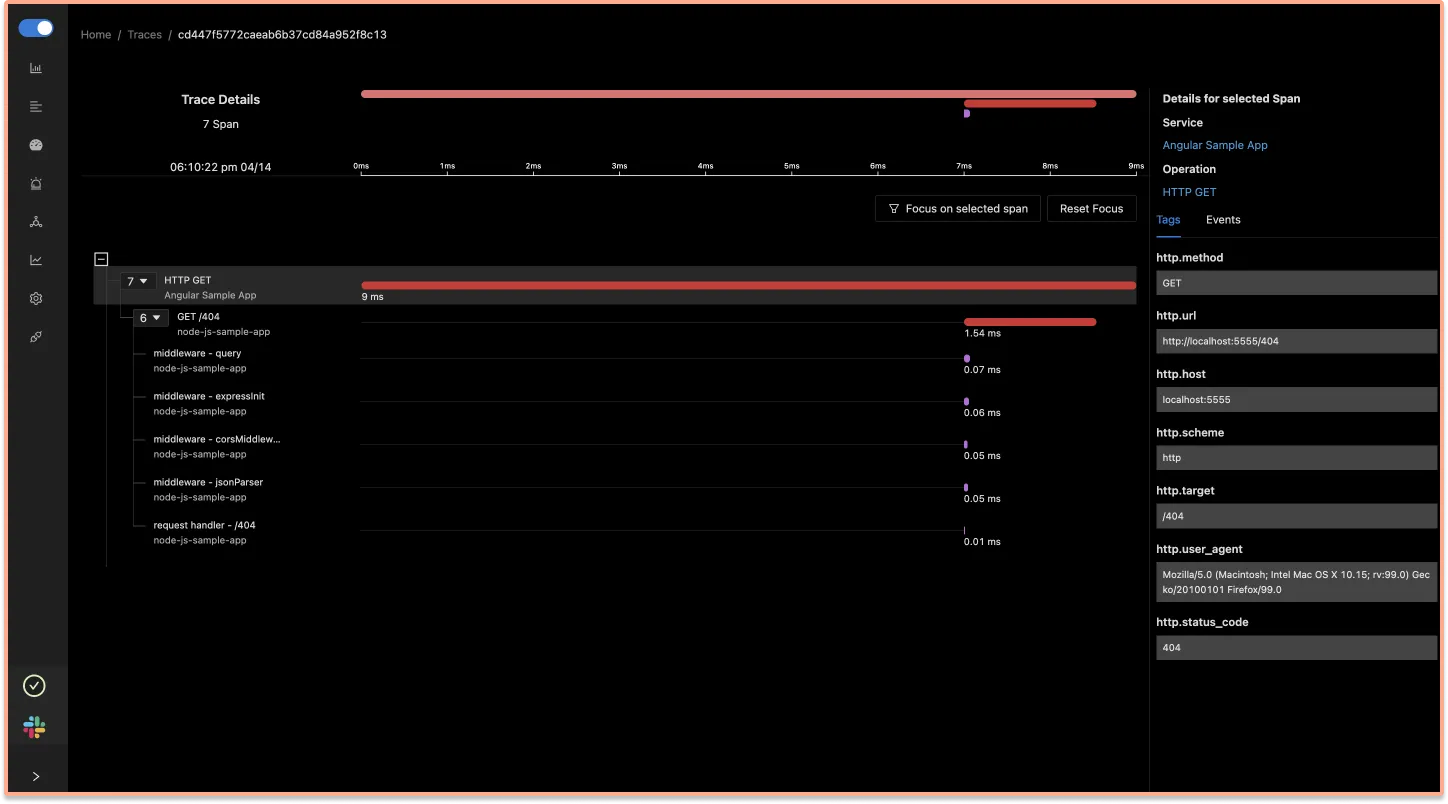
Benefits of Using OpenTelemetry with Angular
Implementing OpenTelemetry in Angular applications offers numerous advantages for developers and organizations. Let's explore the key benefits and specific use cases:
1. Comprehensive Observability
Benefit: OpenTelemetry provides a unified approach to observability, covering traces, metrics, and logs.
Use Case: In a complex Angular application with multiple services and APIs, OpenTelemetry can trace user interactions from the frontend through various backend services, providing a complete picture of the application's behavior.
Performance Improvement: Identifying bottlenecks across the entire application stack, potentially reducing end-to-end response times by 30-50% in complex scenarios.
2. Vendor Neutrality
Benefit: OpenTelemetry's vendor-neutral approach allows you to switch between different observability backends without changing your instrumentation code.
Use Case: An organization using a commercial APM tool can gradually transition to an open-source solution like SigNoz without rewriting their instrumentation, saving weeks of development time.
Performance Improvement: Flexibility to choose the most performant or cost-effective backend for your specific needs, potentially reducing observability costs by 40-60%.
3. Detailed Frontend Performance Insights
Benefit: OpenTelemetry can provide granular insights into Angular-specific operations and user interactions.
Use Case: Tracking component render times, change detection cycles, and user interactions (like button clicks or form submissions) to identify UI performance issues.
Performance Improvement: Fine-tuning based on these insights can lead to 20-40% improvement in perceived application responsiveness.
4. Correlation Between Frontend and Backend
Benefit: OpenTelemetry allows for tracing requests from the user's browser through your Angular app and into backend services.
Use Case: Debugging a slow user transaction by following its path through the entire system, from UI interaction to database queries.
Performance Improvement: This end-to-end visibility can lead to more efficient problem resolution, reducing MTTR (Mean Time To Resolution) by up to 70%.
5. Custom Business Metrics
Benefit: OpenTelemetry allows you to define and track custom metrics that are specific to your business logic.
Use Case: In an e-commerce Angular application, you can track metrics like cart abandonment rate, checkout flow efficiency, or product search accuracy.
Performance Improvement: Insights from custom metrics can drive UX improvements, potentially increasing conversion rates by 10-20%.
6. Improved Error Tracking and Debugging
Benefit: OpenTelemetry provides detailed context around errors, including the full trace leading up to the error.
Use Case: When a user reports an error, developers can see the exact sequence of events and state of the application at the time of the error.
Performance Improvement: This context can reduce debugging time by 40-60%, leading to faster issue resolution and improved application stability.
7. Performance Baseline and Regression Detection
Benefit: Continuous monitoring with OpenTelemetry allows you to establish performance baselines and detect regressions quickly.
Use Case: Automatically detecting performance degradation after a new deployment, allowing for quick rollback or fixes.
Performance Improvement: Early detection of performance issues can prevent 90% of performance-related user complaints before they occur.
8. Load Testing and Capacity Planning
Benefit: OpenTelemetry data can inform load testing strategies and capacity planning.
Use Case: Using production telemetry data to simulate realistic load scenarios and predict infrastructure needs for upcoming high-traffic events.
Performance Improvement: More accurate capacity planning can lead to 20-30% cost savings on infrastructure while ensuring application performance during peak loads.
By leveraging these benefits, Angular developers can create more robust, performant, and user-friendly applications while also streamlining their development and operations processes.
Common Challenges and Troubleshooting Tips for OpenTelemetry in Angular
When implementing OpenTelemetry in Angular applications, you may encounter several challenges. Here are some common issues and their solutions:
1. Context Propagation Issues
Challenge: Traces not connecting properly across different services or components.
Solution:
- Ensure that the
W3CTraceContextPropagatoris properly configured in yourapp.module.ts. - Use the
@opentelemetry/context-zonepackage to manage context in Angular's Zone.js.
Example configuration:
import { W3CTraceContextPropagator } from '@opentelemetry/core';
import { ZoneContextManager } from '@opentelemetry/context-zone';

// In your OpenTelemetry configuration
const provider = new WebTracerProvider({
  // ... other config
});

provider.register({
  propagator: new W3CTraceContextPropagator(),
  contextManager: new ZoneContextManager()
});
2. Performance Overhead
Challenge: Noticeable performance degradation after implementing OpenTelemetry.
Solution:
- Use sampling to reduce the volume of telemetry data.
- Optimize your instrumentation by focusing on critical paths.
Example of configuring a sampler:
import { ParentBasedSampler, TraceIdRatioBasedSampler } from '@opentelemetry/core';

const sampler = new ParentBasedSampler({
  root: new TraceIdRatioBasedSampler(0.5), // Sample 50% of traces
});

const provider = new WebTracerProvider({
  sampler,
  // ... other config
});
3. Asynchronous Operations Not Being Traced
Challenge: Traces not capturing asynchronous operations correctly.
Solution:
- Ensure that Zone.js is properly integrated with OpenTelemetry.
- Manually create spans for complex asynchronous operations.
Example of manually creating a span:
import { trace } from '@opentelemetry/api';

async function complexOperation() {
  const span = trace.getTracer('my-tracer').startSpan('complexOperation');
  try {
    // Perform async operation
    await someAsyncTask();
    span.end();
  } catch (error) {
    span.recordException(error);
    span.end();
    throw error;
  }
}
4. Incorrect Configuration of Exporters
Challenge: Telemetry data not reaching the backend (e.g., SigNoz).
Solution:
- Double-check the exporter configuration, especially the endpoint URLs.
- Ensure that CORS is properly configured if your collector is on a different domain.
Example of configuring the OTLPTraceExporter:
import { OTLPTraceExporter } from '@opentelemetry/exporter-trace-otlp-http';

const exporter = new OTLPTraceExporter({
  url: 'http://your-collector-url:4318/v1/traces', // Adjust this URL
});

const provider = new WebTracerProvider();
provider.addSpanProcessor(new BatchSpanProcessor(exporter));
5. Handling Third-Party Libraries
Challenge: Difficulty in tracing operations within third-party libraries.
Solution:
- Use auto-instrumentation packages when available.
- For libraries without auto-instrumentation, wrap their methods with custom spans.
Example of wrapping a third-party library method:
import { trace } from '@opentelemetry/api';

function wrapThirdPartyMethod(originalMethod) {
  return function(...args) {
    const span = trace.getTracer('my-tracer').startSpan('thirdPartyOperation');
    try {
      const result = originalMethod.apply(this, args);
      span.end();
      return result;
    } catch (error) {
      span.recordException(error);
      span.end();
      throw error;
    }
  }
}

// Usage
thirdPartyLibrary.someMethod = wrapThirdPartyMethod(thirdPartyLibrary.someMethod);
By being aware of these common challenges and their solutions, you can more effectively implement and troubleshoot OpenTelemetry in your Angular applications.
Comparison: OpenTelemetry vs Other Monitoring Solutions for Angular
When choosing a monitoring solution for Angular applications, developers have several options. Here's how OpenTelemetry compares to other popular monitoring solutions:
OpenTelemetry vs Google Analytics
| Feature | OpenTelemetry | Google Analytics |
|---|---|---|
| Primary Focus | Application Performance | User Behavior |
| Customizability | Highly customizable | Limited customization |
| Data Ownership | Self-hosted or choice of backend | Google-hosted |
| Technical Depth | Deep technical insights | Surface-level technical data |
| Cost | Open-source, backend costs vary | Free tier available, paid for advanced features |
Key Difference: OpenTelemetry provides deep technical insights into application performance, while Google Analytics focuses on user behavior and high-level metrics.
OpenTelemetry vs New Relic
| Feature | OpenTelemetry | New Relic |
|---|---|---|
| Vendor Lock-in | No lock-in | Proprietary solution |
| Setup Complexity | Moderate | Low |
| Customizability | Highly customizable | Customizable within platform limits |
| Cost | Open-source, backend costs vary | Subscription-based, can be expensive at scale |
| Out-of-the-box Features | Requires configuration | Many features available immediately |
Key Difference: OpenTelemetry offers more flexibility and avoids vendor lock-in, while New Relic provides a more turnkey solution with a steeper cost curve.
OpenTelemetry vs Sentry
| Feature | OpenTelemetry | Sentry |
|---|---|---|
| Primary Focus | Comprehensive observability | Error tracking and performance |
| Language Support | Wide language support | Wide language support |
| Integration Effort | Moderate | Low |
| Real User Monitoring | Possible with custom implementation | Built-in RUM features |
| Cost | Open-source, backend costs vary | Free tier, paid plans for advanced features |
Key Difference: OpenTelemetry provides a more comprehensive observability solution, while Sentry excels in error tracking and offers easier integration for basic use cases.
OpenTelemetry vs Custom Logging Solution
| Feature | OpenTelemetry | Custom Logging |
|---|---|---|
| Standards Compliance | Industry standard | Custom implementation |
| Community Support | Large community | No community support |
| Integration with Tools | Wide range of integrations | Limited to custom integrations |
| Development Time | Reduced development time | Significant development time |
| Scalability | Designed for scale | Depends on implementation |
Key Difference: OpenTelemetry provides a standardized, scalable solution with community support, while custom logging offers maximum control but requires significant development effort.
Best Practices for Configuring OpenTelemetry in Production Angular Environments
When deploying Angular applications instrumented with OpenTelemetry to production, it's crucial to optimize for performance, reliability, and security. Here are some best practices to consider:
1. Implement Proper Sampling
- Use intelligent sampling to reduce data volume without losing important information.
- Consider using a parent-based sampler to maintain consistency across traces.
Example configuration:
import { ParentBasedSampler, TraceIdRatioBasedSampler } from '@opentelemetry/core';

const sampler = new ParentBasedSampler({
  root: new TraceIdRatioBasedSampler(0.1), // Sample 10% of traces
});

const provider = new WebTracerProvider({
  sampler,
  // other config...
});
2. Use Batch Processing
- Implement batch processing to reduce network overhead and improve performance.
Example:
import { BatchSpanProcessor } from '@opentelemetry/sdk-trace-base';
import { OTLPTraceExporter } from '@opentelemetry/exporter-trace-otlp-http';

const exporter = new OTLPTraceExporter({
  url: 'https://your-collector-endpoint',
});

const provider = new WebTracerProvider();
provider.addSpanProcessor(new BatchSpanProcessor(exporter, {
  maxQueueSize: 100,
  maxExportBatchSize: 10,
  scheduledDelayMillis: 500,
}));
3. Secure Your Data
- Use HTTPS for all communication with your collector.
- Implement proper authentication for your collector endpoints.
- Be cautious about what data you include in spans, avoiding sensitive information.
4. Optimize Performance
- Use async operations where possible to avoid blocking the main thread.
- Implement custom spans judiciously, focusing on critical paths and operations.
Example of an optimized custom span:
import { trace } from '@opentelemetry/api';

async function performCriticalOperation() {
  const span = trace.getTracer('critical-ops').startSpan('criticalOperation');
  try {
    // Perform operation
    const result = await someAsyncOperation();
    span.setAttributes({ 'operation.result': result });
    return result;
  } catch (error) {
    span.recordException(error);
    throw error;
  } finally {
    span.end();
  }
}
5. Implement Proper Error Handling
- Ensure all exceptions are properly caught and recorded in spans.
- Use span events to record important application events.
6. Use Resource Detection
- Implement resource detection to automatically capture environment information.
Example:
import { Resource } from '@opentelemetry/resources';
import { SemanticResourceAttributes } from '@opentelemetry/semantic-conventions';

const resource = Resource.default().merge(
  new Resource({
    [SemanticResourceAttributes.SERVICE_NAME]: 'my-angular-app',
    [SemanticResourceAttributes.SERVICE_VERSION]: '1.0.0',
    environment: 'production',
  })
);

const provider = new WebTracerProvider({
  resource: resource,
  // other config...
});
7. Monitor Your Monitoring
- Implement health checks for your OpenTelemetry pipeline.
- Set up alerts for issues with data collection or exporting.
Conclusion
OpenTelemetry stands out for its:
- Vendor neutrality and flexibility
- Comprehensive observability (traces, metrics, and logs)
- Strong community support and ongoing development
- Potential for deep, customized insights into application performance
However, it may require more initial setup and configuration compared to some out-of-the-box solutions.
The choice between OpenTelemetry and other solutions depends on factors such as:
- The need for customization and depth of insights
- Available development resources
- Long-term scalability requirements
- Budget constraints
- Existing tool integrations
For many Angular applications, especially those with complex architectures or high scalability needs, OpenTelemetry provides a powerful and flexible foundation for observability that can grow with your application.
Conclusion
Using OpenTelemetry Angular libraries, you can instrument your frontend applications for end-to-end tracing. You can then use an open-source APM tool like SigNoz to ensure the smooth performance of your Angular apps.
OpenTelemetry is the future for setting up observability for cloud-native apps. It is backed by a huge community and covers a wide variety of technology and frameworks. Using OpenTelemetry, engineering teams can instrument polyglot and distributed applications with peace of mind.
SigNoz is an open-source observability tool that comes with a SaaS-like experience. You can try out SigNoz by visiting its GitHub repo 👇

If you are someone who understands more from video, then you can watch the our video tutorial on how to implement OpenTelemetry Angular libraries and monitor the application with SigNoz.
If you face any issues while trying out SigNoz, you can reach out with your questions in #support channel 👇

Key Takeaways
- OpenTelemetry provides a standardized approach to observability in Angular applications.
- Proper setup and configuration, including Zone Context integration, are crucial for effective tracing.
- Custom instrumentation allows you to gain insights into Angular-specific operations.
- SigNoz offers a comprehensive solution for visualizing and analyzing OpenTelemetry data.
- Advanced techniques can significantly enhance your application performance insights.
FAQs
How does OpenTelemetry differ from other Angular monitoring solutions?
OpenTelemetry stands out due to its vendor-neutral approach and comprehensive coverage of both frontend and backend operations. Unlike some Angular-specific solutions, OpenTelemetry allows for standardized instrumentation across your entire stack.
Can OpenTelemetry impact my Angular app's performance?
While OpenTelemetry does add some overhead, it's designed to be lightweight. With proper configuration and use of sampling techniques, the impact on your application's performance should be minimal.
Is it possible to use OpenTelemetry with existing monitoring tools?
Yes, OpenTelemetry is designed to be compatible with many existing monitoring solutions. You can often export OpenTelemetry data to your current tools, allowing for a gradual transition or hybrid approach.
How can I troubleshoot common OpenTelemetry issues in Angular?
Common issues often relate to context propagation or incorrect configuration. Start by verifying your setup, checking console outputs, and ensuring Zone Context is properly integrated. If problems persist, the OpenTelemetry community forums are an excellent resource for troubleshooting.
Further Reading
Monitor gRPC calls with OpenTelemetry
Distributed Tracing for a nodejs application

