OpenTelemetry is a Cloud Native Computing Foundation(CNCF) incubating project aimed at standardizing the way we instrument applications for generating telemetry data(logs, metrics, and traces). OpenTelemetry aims to provide a vendor-agnostic observability framework that provides a set of tools, APIs, and SDKs to instrument applications.

Modern-day software systems are built with many pre-built components taken from the open source ecosystem like web frameworks, databases, HTTP clients, etc. Instrumenting such a software system in-house can pose a huge challenge. And using vendor-specific instrumentation agents can create a dependency. OpenTelemetry provides an open source instrumentation layer that can instrument various technologies like open source libraries, programming languages, databases, etc.
This is a complete guide on OpenTelemetry logs. We are covering the following sections in this guide:
- What is OpenTelemetry?
- What are OpenTelemetry Logs?
- OpenTelemetry's Log Data Model
- Limitations of existing logging solutions
- Why Correlation of telemetry signals is Important?
- Collecting log data with OpenTelemetry
- Log processing with OpenTelemetry
- SigNoz - a full-stack logging system based on OpenTelemetry
- Getting started with SigNoz
- OpenTelemetry logs are the way forward!
With OpenTelemetry instrumentation, you can collect four telemetry signals:
Traces
Traces help track user requests across services.Metrics
Metrics are measurements at specific timestamps to monitor performance like server response times, memory utilization, etc.Logs
Logs are text records - structured or unstructured- containing information about activities and operations within an operating system, application, server, etc.Baggage
Baggage helps to pass information with context propagation between two process boundaries.
Before deep diving into OpenTelemetry logs, let's briefly overview OpenTelemetry.
What is OpenTelemetry?
OpenTelemetry provides instrumentation libraries for your application. The development of these libraries is guided by the OpenTelemetry specification. The OpenTelemetry specification describes the cross-language requirements and design expectations for all OpenTelemetry implementations in various programming languages.
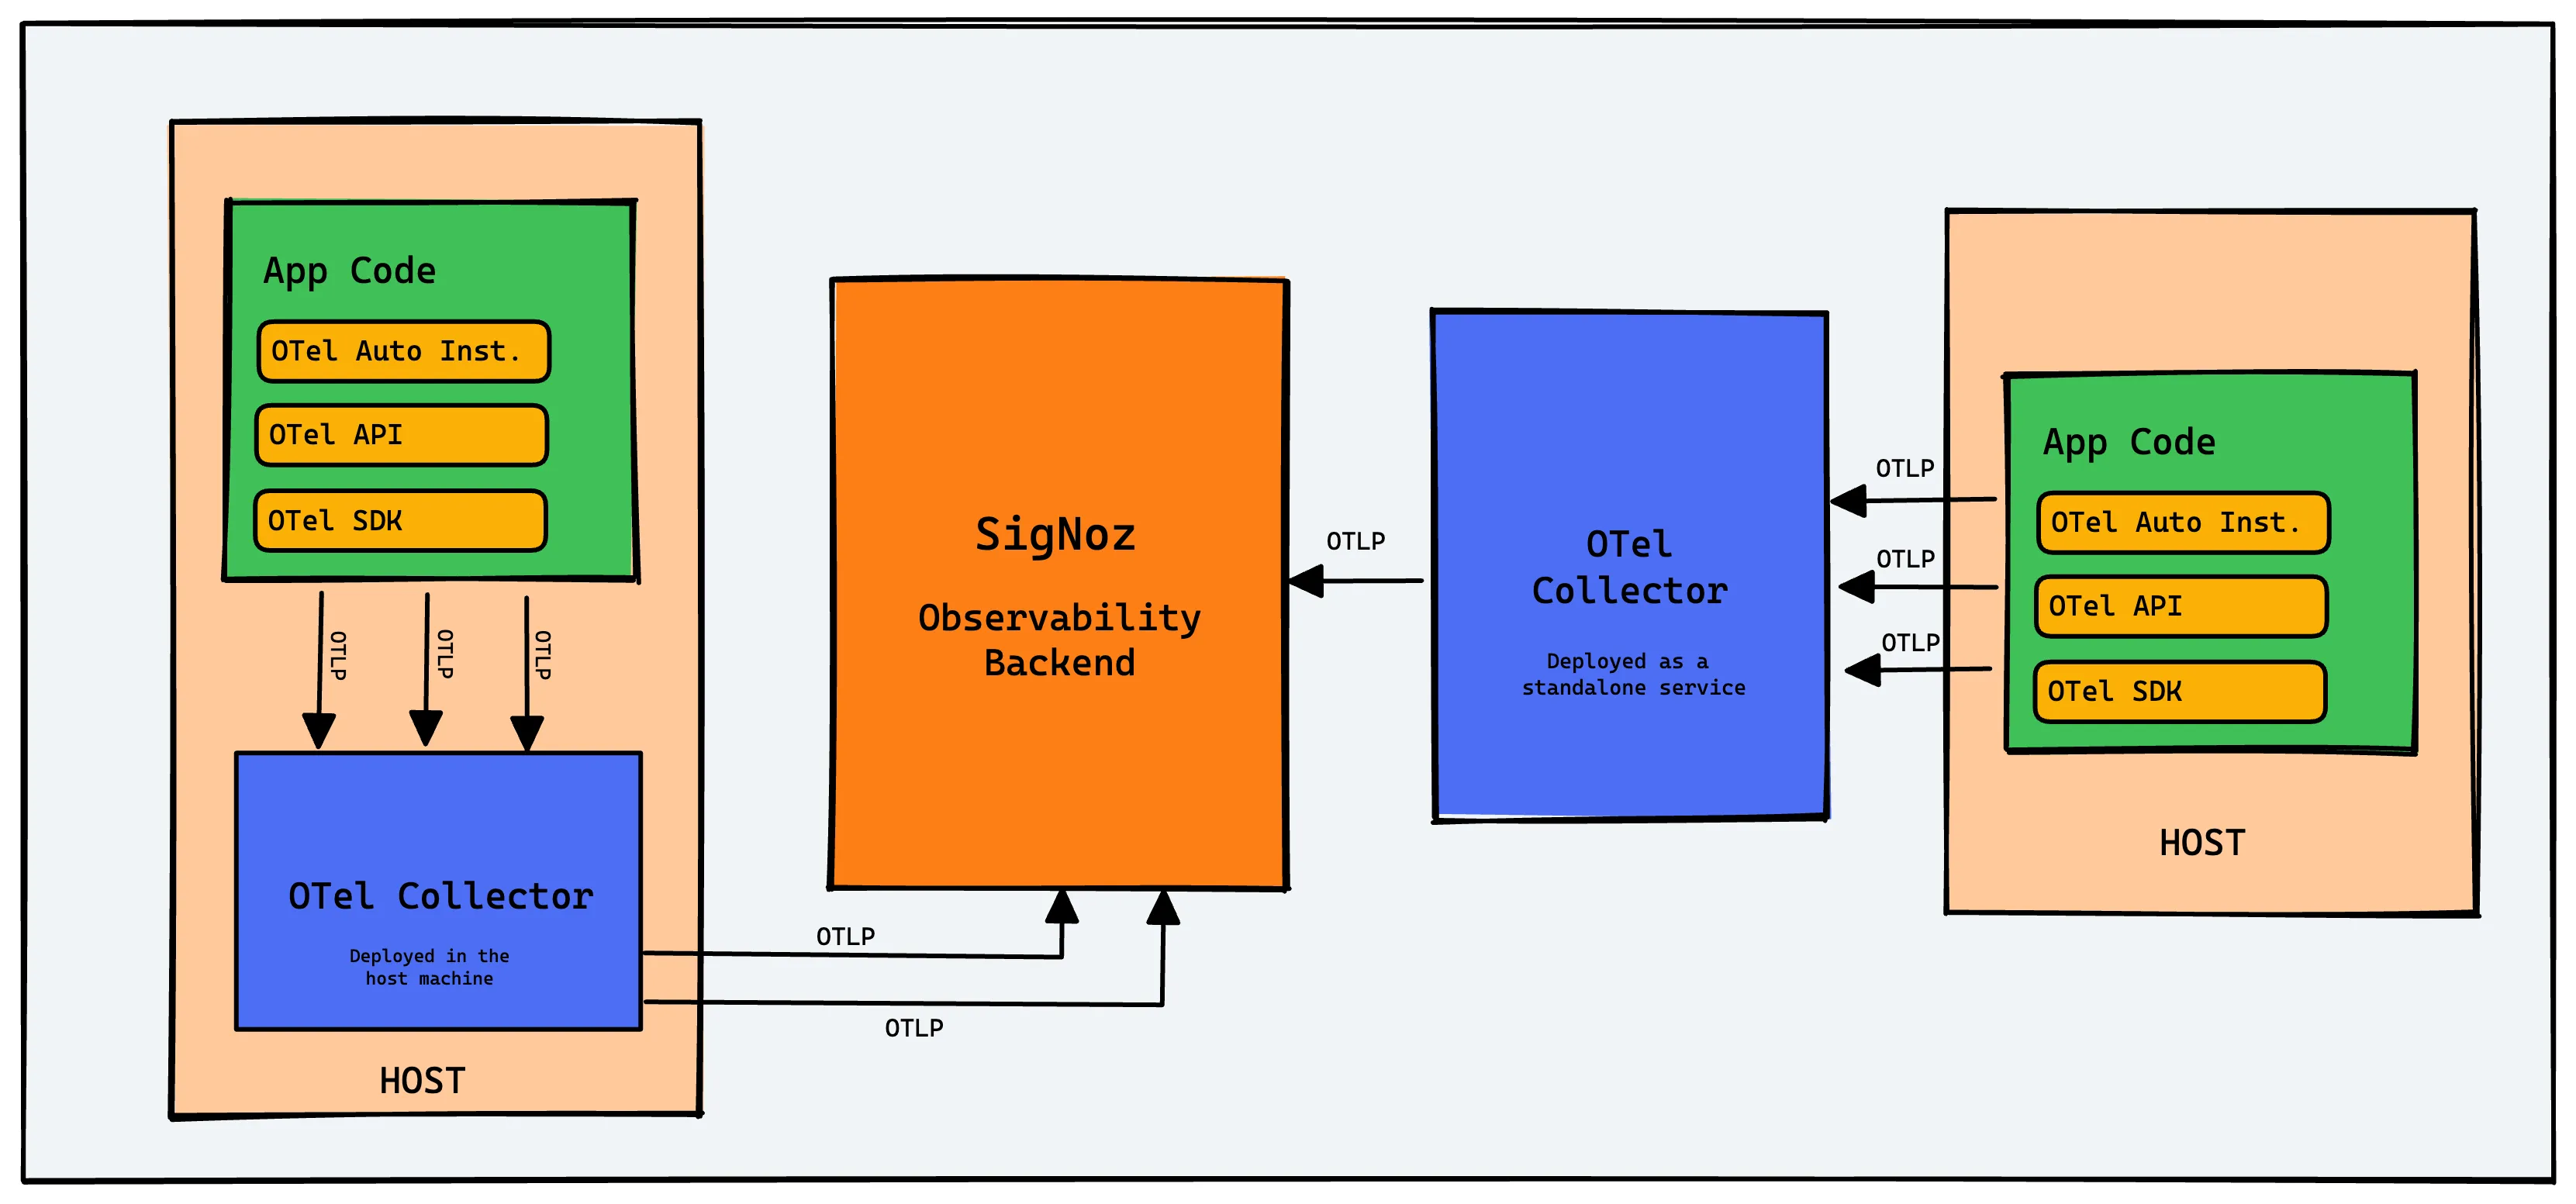
OpenTelemetry libraries can be used to generate logs, metrics, and traces. You can then collect these signals with OpenTelemetry Collector or send them to an observability backend of your choice. In this article, we will focus on OpenTelemetry logs. OpenTelemetry can be used to collect log data and process it. Let's explore OpenTelemetry logs further.
What are OpenTelemetry Logs?
You can generate logs using OpenTelemetry SDK's in different languages. Unlike traces and metrics, OpenTelemetry logs take a different approach. In order to be successful, OpenTelemetry needs to support the existing legacy of logs and logging libraries. And this is the main design philosophy of OpenTelemetry logs. But it is not limited to this. With time, OpenTelemetry aims to integrate logs better with other signals.
A log usually captures an event and stores it as a text record. Developers use log data to debug applications. There are many types of log data:
Application logs
Application logs contain information about events that have occurred within a software application.System Logs
System logs contain information about events that occur within the operating system itself.Network logs
Devices in the networking infrastructure provide various logs based on their network activity.Web server logs
Popular web servers like Apache and NGINX produce log files that can be used to identify performance bottlenecks.
Most of these logs are either computer generated or generated by using some well-known logging libraries. Most programming languages have built-in logging capabilities or well-known logging libraries. Using OpenTelemetry Collector, you can collect these logs and send it to a log analysis tool like SigNoz, which supports the OpenTelemetry logs data model.
OpenTelemetry's log data model provides a unified framework to represent logs from various sources, such as application log files, machine-generated events, and system logs.
OpenTelemetry's Log Data Model
The primary goal of OpenTelemetry's log data model is to ensure a common understanding of what constitutes a log record, the data that needs to be recorded, transferred, stored, and interpreted by a logging system.
Why is OpenTelemetry's log data model needed?
1. Unambiguous Mapping: The data model allows existing log formats to be mapped unambiguously to this model. This ensures that translating log data from any log format to this data model and back results in consistent data.
2. Semantic Meaning: It ensures that mappings of other log formats to this data model are semantically meaningful, preserving the semantics of particular elements of existing log formats.
3. Efficiency: The data model is designed to be efficiently represented in implementations that require data storage or transmission, focusing on CPU usage for serialization/deserialization and space requirements in serialized form.
Key Components Of OpenTelemetry's log data model
Timestamp: Represents the time when the event occurred.
ObservedTimestamp: The time when the event was observed by the collection system.
Trace Context Fields: These include TraceId, SpanId, and TraceFlags which are essential for correlating logs with traces.
Severity Fields: These include SeverityText and SeverityNumber which represent the severity or log level of the event.
Body: Contains the main content of the log record. It can be a human-readable string message or structured data.
Resource: Describes the source of the log.
InstrumentationScope: Represents the instrumentation scope, which can be useful for sources that define a logger name.
Attributes: Provides additional information about the specific event occurrence.
An example of a log record following OpenTelemetry log data model in JSON format might look like this:
{
  "Timestamp": "1634630400000",
  "ObservedTimestamp": "1634630401000",
  "TraceId": "abcd1234",
  "SpanId": "efgh5678",
  "SeverityText": "ERROR",
  "SeverityNumber": "17",
  "Body": "An error occurred while processing the request.",
  "Resource": {
    "service.name": "web-backend",
    "host.name": "web-server-1"
  },
  "InstrumentationScope": {
    "Name": "JavaLogger",
    "Version": "1.0.0"
  },
  "Attributes": {
    "http.method": "GET",
    "http.status_code": "500"
  }
}
This example represents a log record from a backend service, indicating an error during request processing. The log is associated with a specific trace and span, has a severity of "ERROR", and includes additional attributes related to the HTTP request.
Limitations of existing logging solutions
For a robust observability framework, all telemetry signals should be easily correlated. But most application owners have disparate tools to collect each telemetry signal and no way to correlate the signals. Current logging solutions don’t support integrating logs with other observability signals.
Existing logging solutions also don’t have any standardized way to propagate and record the request execution context. Without request execution context, collected logs are disassociated sets from different components of a software system. But having contextual log data can help draw quicker insights. OpenTelemetry aims to collect log data with request execution context and to correlate it with other observability signals
Why Correlation is Important?
Root Cause Analysis: When an issue arises, correlating logs with traces can help identify the root cause. For instance, an error trace can be linked to specific log entries that provide detailed error messages.
Performance Optimization: By correlating metrics with traces, one can identify performance bottlenecks. For example, a spike in response time metric can be correlated with specific trace spans to identify slow-performing services or operations.
Holistic View: Correlation provides a complete picture of the system, allowing developers and operators to understand how different components interact and affect each other.
Collecting log data with OpenTelemetry
OpenTelemetry provides various receivers and processors for collecting first-party and third-party logs directly via OpenTelemetry Collector or via existing agents such as FluentBit so that minimal changes are required to move to OpenTelemetry for logs.
Collecting legacy first-party application logs
These applications are built in-house and use existing logging libraries. The logs from these applications can be pushed to OpenTelemetry with little to no changes in the application code. OpenTelemetry provides a trace_parser with which you can add context IDs to your logs to correlate them with other signals.
In OpenTelemetry, there are two important context IDs for context propagation.
Trace IDs
A trace is a complete breakdown of a transaction as it travels through different components of a distributed system. Each trace gets a trace ID that helps to correlate all events connected with a single trace.Span IDs
A trace consists of multiple spans. Each span represents a single unit of logical work in the trace data. Spans have span ids that are used to represent the parent-child relationship.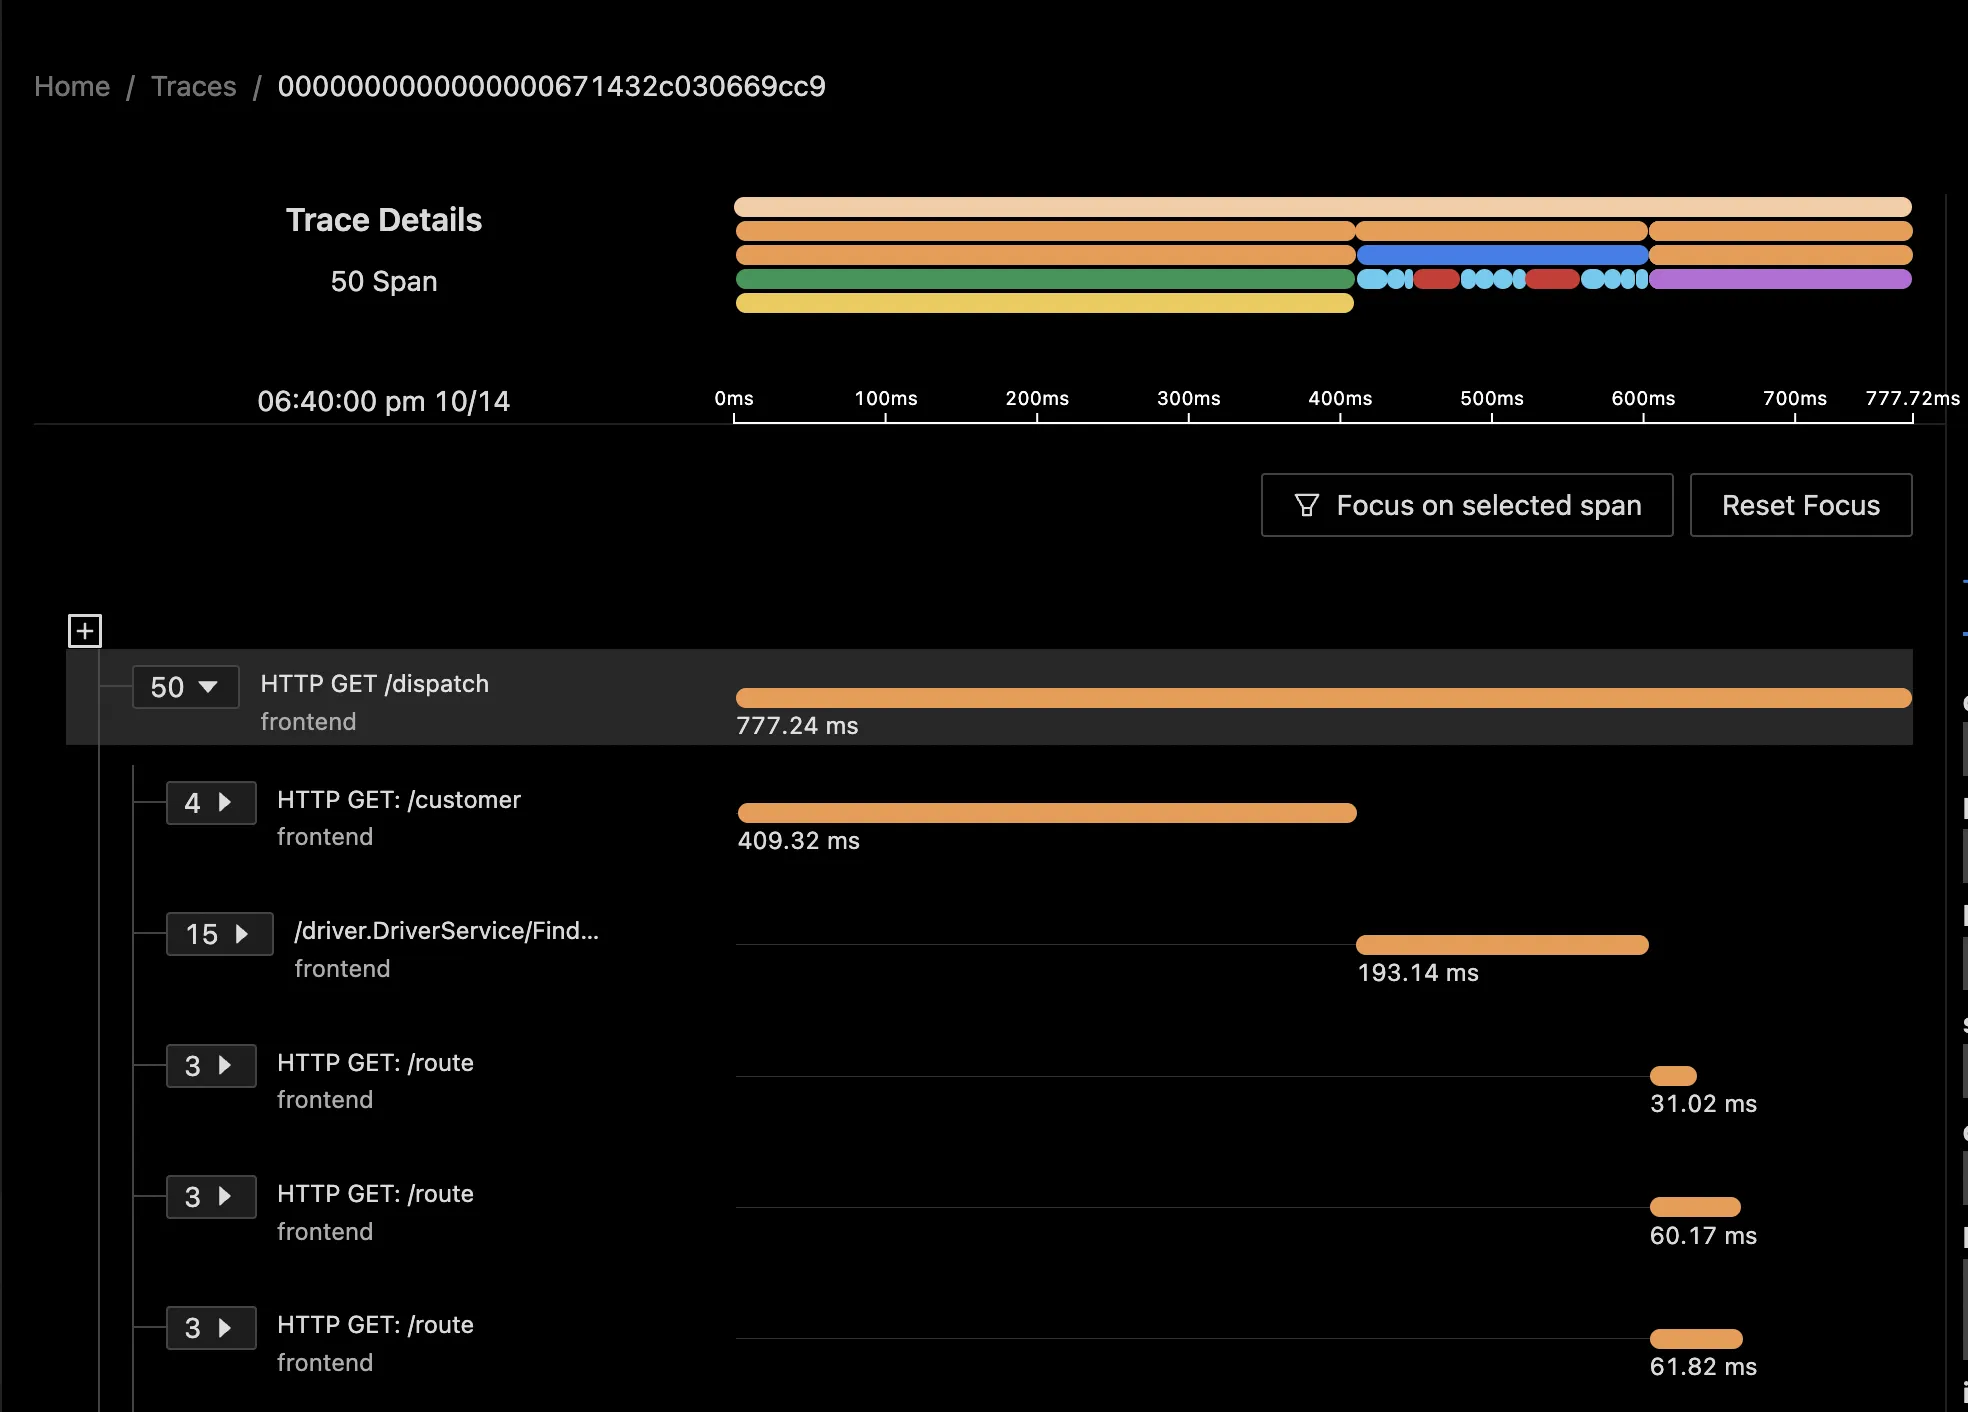
A trace graph broken down into individual spans visualized as Flamegraphs and Gantt charts in SigNoz dashboard
Correlating your logs with traces can help drive deeper insights. If you don’t have request context like traceId and spanId in your logs, you might want to add them for easier correlation with metrics and traces.
There are two ways to collect application logs:
Via File or Stdout Logs
Here, the logs of the application are directly collected by the OpenTelemetry receiver using collectors like filelog receiver. Then operators and processors are used for parsing them into the OpenTelemetry log data model.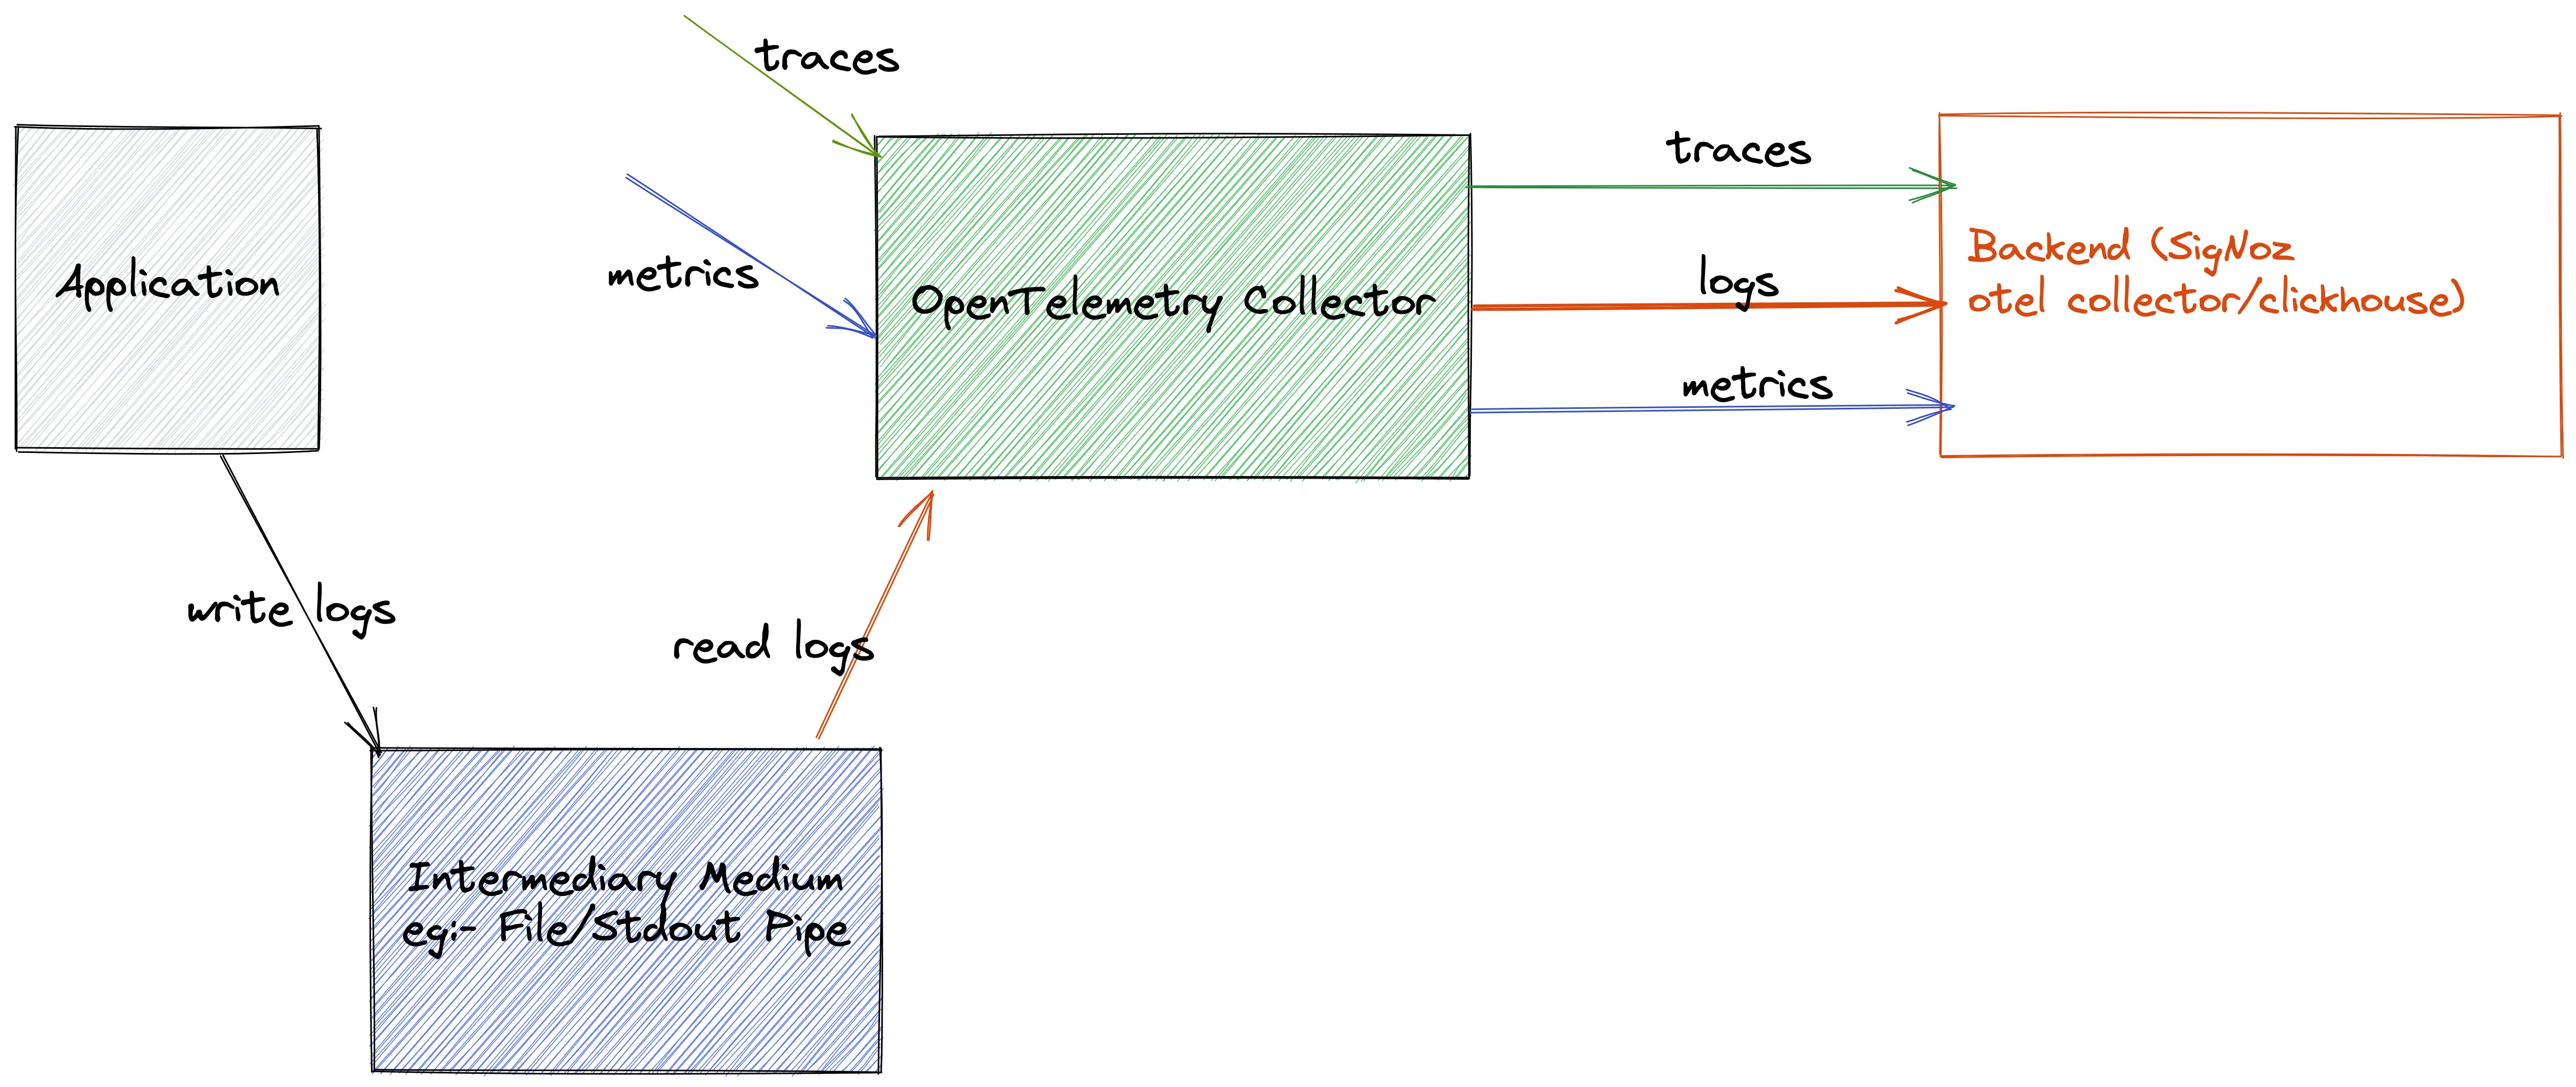
Collecting logs via file or Stdout logs For advanced parsing and collecting capabilities, you can also use something like FluentBit or Logstash. The agents can push the logs to the OpenTelemetry collector using protocols like FluentForward/TCP/UDP, etc.
Directly to OpenTelemetry Collector
In this approach, you can modify your logging library that is used by the application to use the logging SDK provided by OpenTelemetry and directly forward the logs from the application to OpenTelemetry. This approach removes any need for agents/intermediary medium but loses the simplicity of having the log file locally.
Collecting third-party application log data
Logs emitted by third-party applications running on the system are known as third-party application logs. The logs are typically written to stdout, files, or other specialized mediums. For example, Windows event logs for applications.
These logs can be collected using the OpenTelemetry file receiver and then processed.
A practical example - Collecting syslogs with OpenTelemetry
You will need OpenTelemetry Collector (otel collector) to collect syslogs. In this example, we will illustrate collecting syslogs from your VM and sending it to SigNoz.
Add otel collector binary to your VM by following this guide.
Add the syslog reciever to
config.yamlto otel-collector.receivers: syslog: tcp: listen_address: "0.0.0.0:54527" protocol: rfc3164 location: UTC operators: - type: move from: attributes.message to: bodyHere we are collecting the logs and moving message from attributes to body using operators that are available. You can read more about operators here.
For more configurations that are available for syslog receiver please check here.
Next we will modify our pipeline inside
config.yamlof otel-collector to include the receiver we have created above.service: .... logs: receivers: [otlp, syslog] processors: [batch] exporters: [otlp]Now we can restart the otel collector so that new changes are applied and we can forward our logs to port
54527.Modify your
rsyslog.conffile present inside/etc/by running the following command:sudo vim /etc/rsyslog.confand adding the this line at the end
template(
  name="UTCTraditionalForwardFormat"
  type="string"
  string="<%PRI%>%TIMESTAMP:::date-utc% %HOSTNAME% %syslogtag:1:32%%msg:::sp-if-no-1st-sp%%msg%"
)

*.* action(type="omfwd" target="0.0.0.0" port="54527" protocol="tcp" template="UTCTraditionalForwardFormat")
For production use cases it is recommended to use something like below:
template(
  name="UTCTraditionalForwardFormat"
  type="string"
  string="<%PRI%>%TIMESTAMP:::date-utc% %HOSTNAME% %syslogtag:1:32%%msg:::sp-if-no-1st-sp%%msg%"
)

*.*  action(type="omfwd" target="0.0.0.0" port="54527" protocol="tcp"
        action.resumeRetryCount="10"
        queue.type="linkedList" queue.size="10000" template="UTCTraditionalForwardFormat")
So that you have retries and queue in place to de-couple the sending from the other logging action. Also we are assuming that you are running the otel binary on the same host. If not, the value of
targetmight change depending on your environment.Now restart your rsyslog service by running
sudo systemctl restart rsyslog.serviceYou can check the status of service by running
sudo systemctl status rsyslog.serviceIf there are no errors your logs will be visible on SigNoz UI.
Log processing with OpenTelemetry
OpenTelemetry provides operators to process logs. An operator is the most basic unit of log processing. Each operator fulfills a single responsibility, such as adding an attribute to a log field or parsing JSON from a field. Operators are then chained together in a pipeline to achieve the desired result.
For example, a user may parse log lines using regex_parser and then use trace_parser to parse the traceId and spanId from the logs.
OpenTelemetry also provides processors for processing logs. Processors are used at various stages of a pipeline. Generally, a processor pre-processes data before it is exported (e.g. modify attributes or sample) or helps ensure that data makes it through a pipeline successfully (e.g. batch/retry).
Processors are also helpful when you have multiple receivers for logs and you want to parse/transforms logs collected from all the receivers. Some well-known log processors are:
- Batch Processor
- Memory Limit Processor
- Attributes Processor
- Resource Processor
SigNoz - a full-stack logging system based on OpenTelemetry
OpenTelemetry provides instrumentation for generating logs. You then need a backend for storing, querying, and analyzing your logs. SigNoz, a full-stack open source APM is built to support OpenTelemetry natively. It uses a columnar database - ClickHouse for storing logs effectively. Big companies like Uber and Cloudflare have shifted to ClickHouse for log analytics.
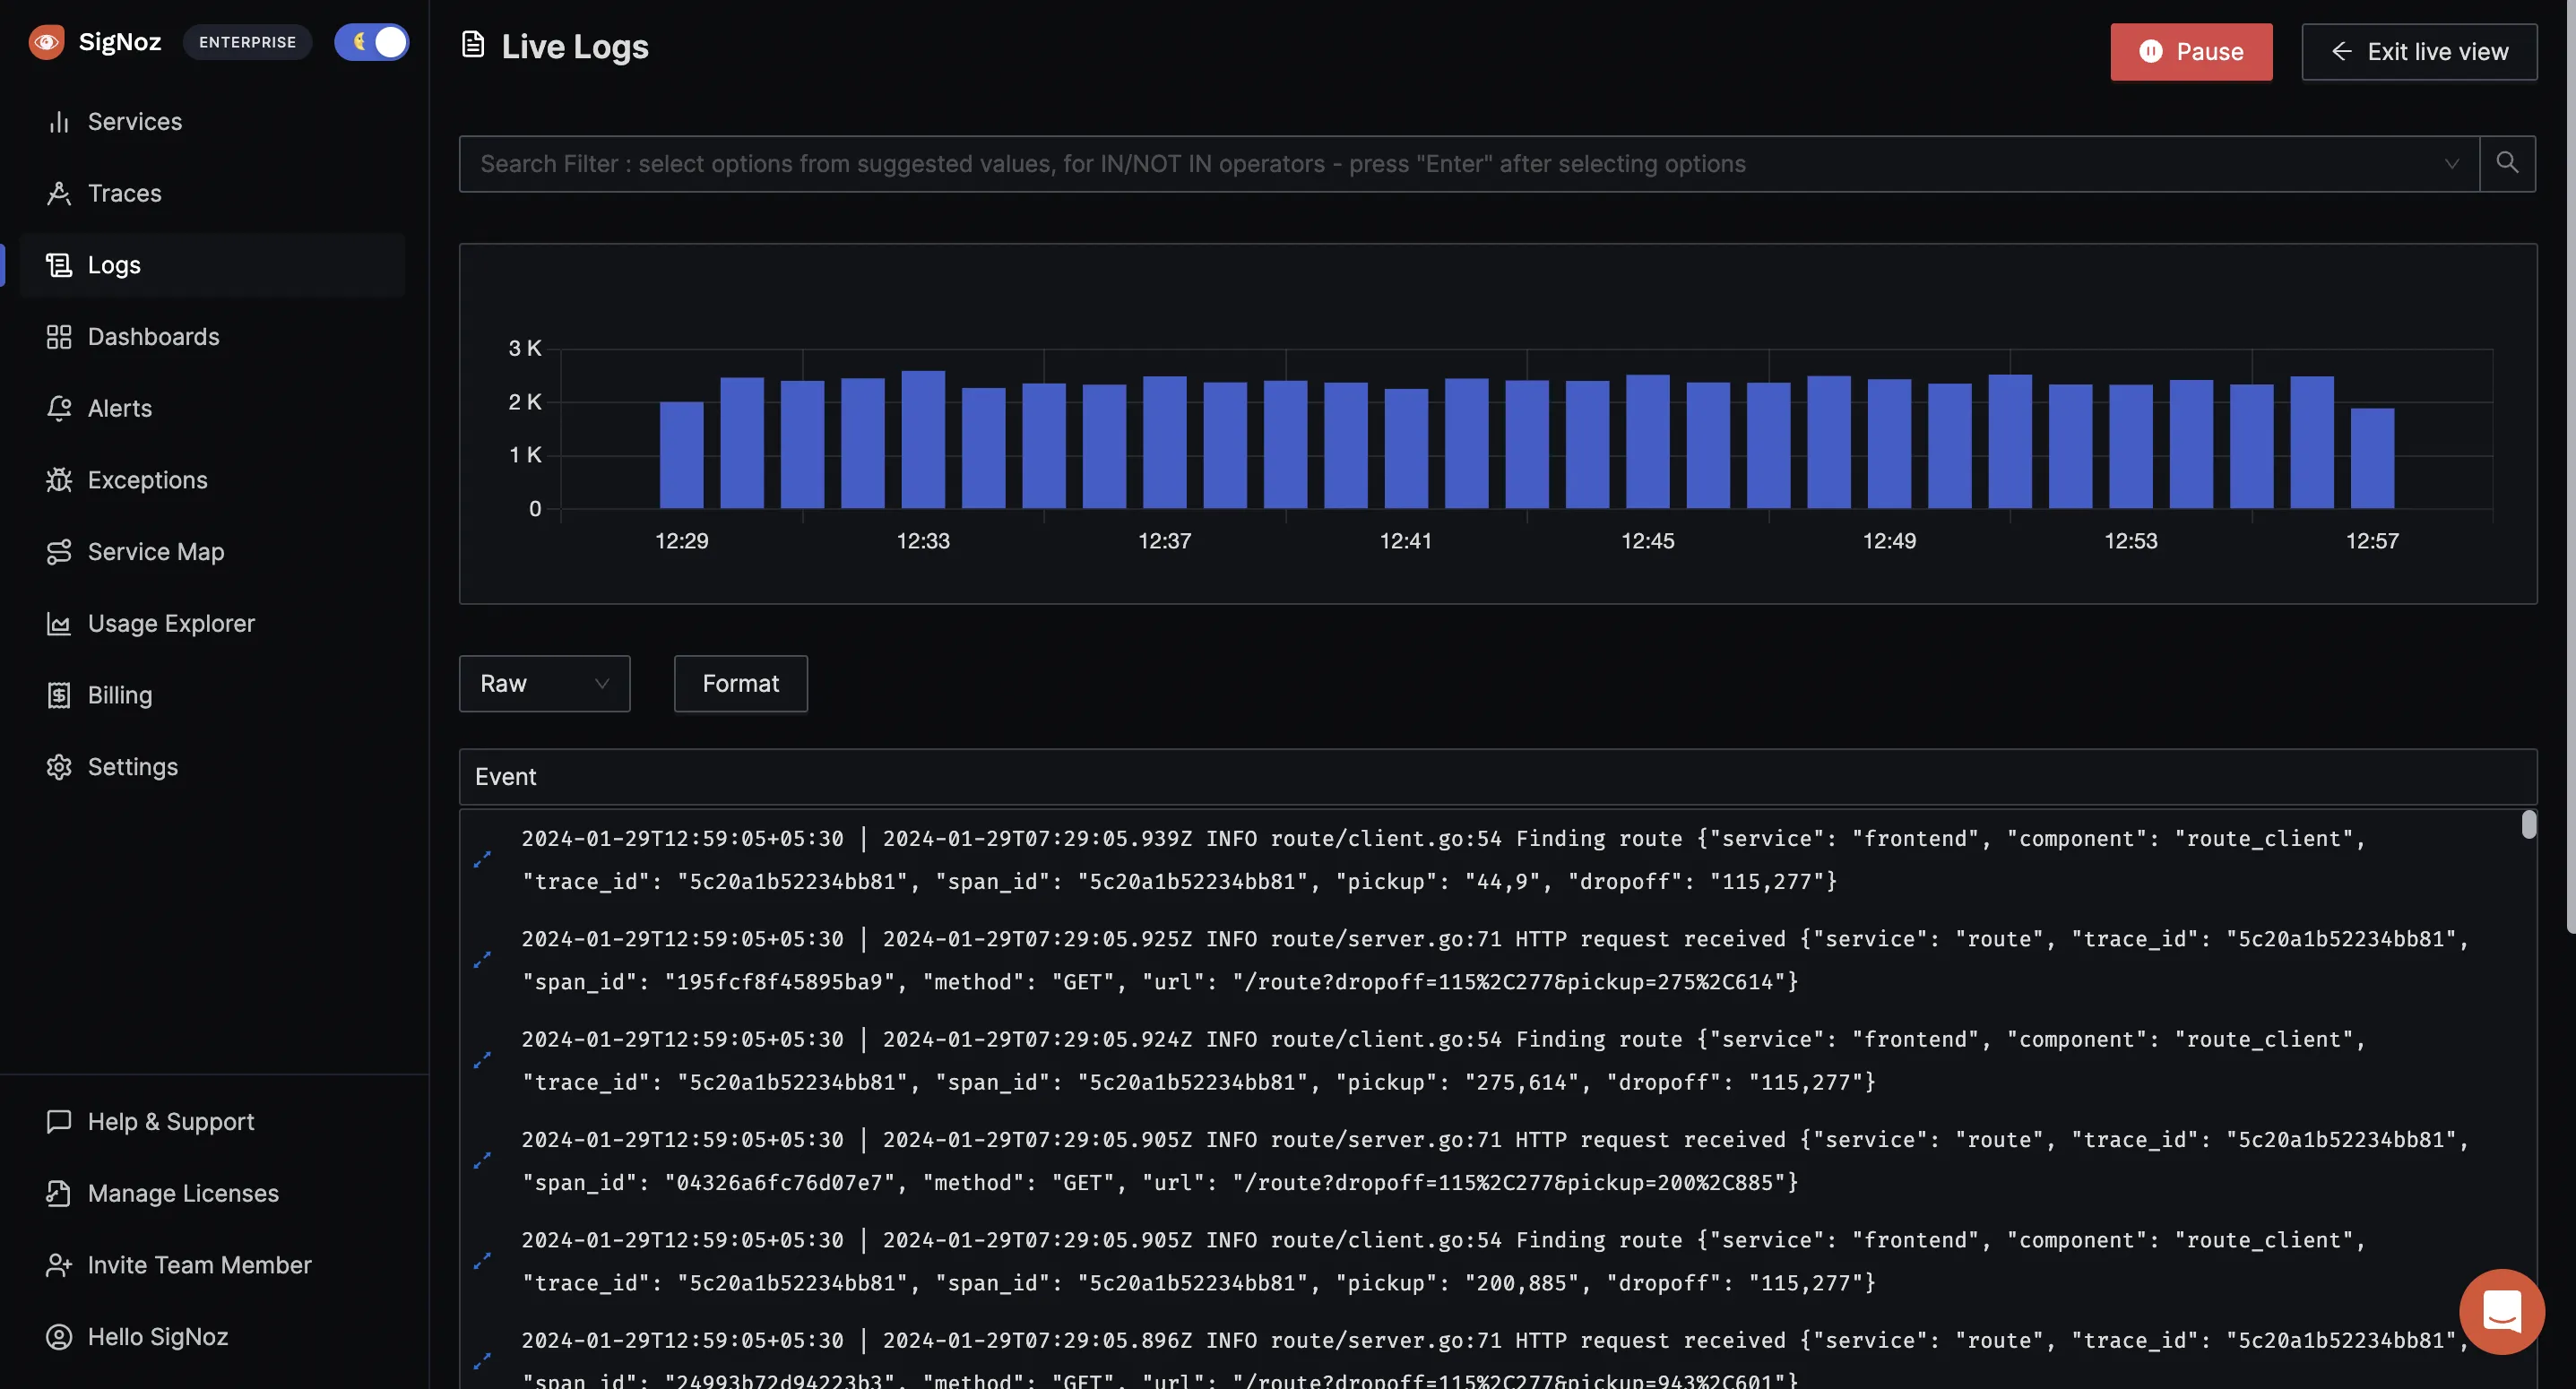
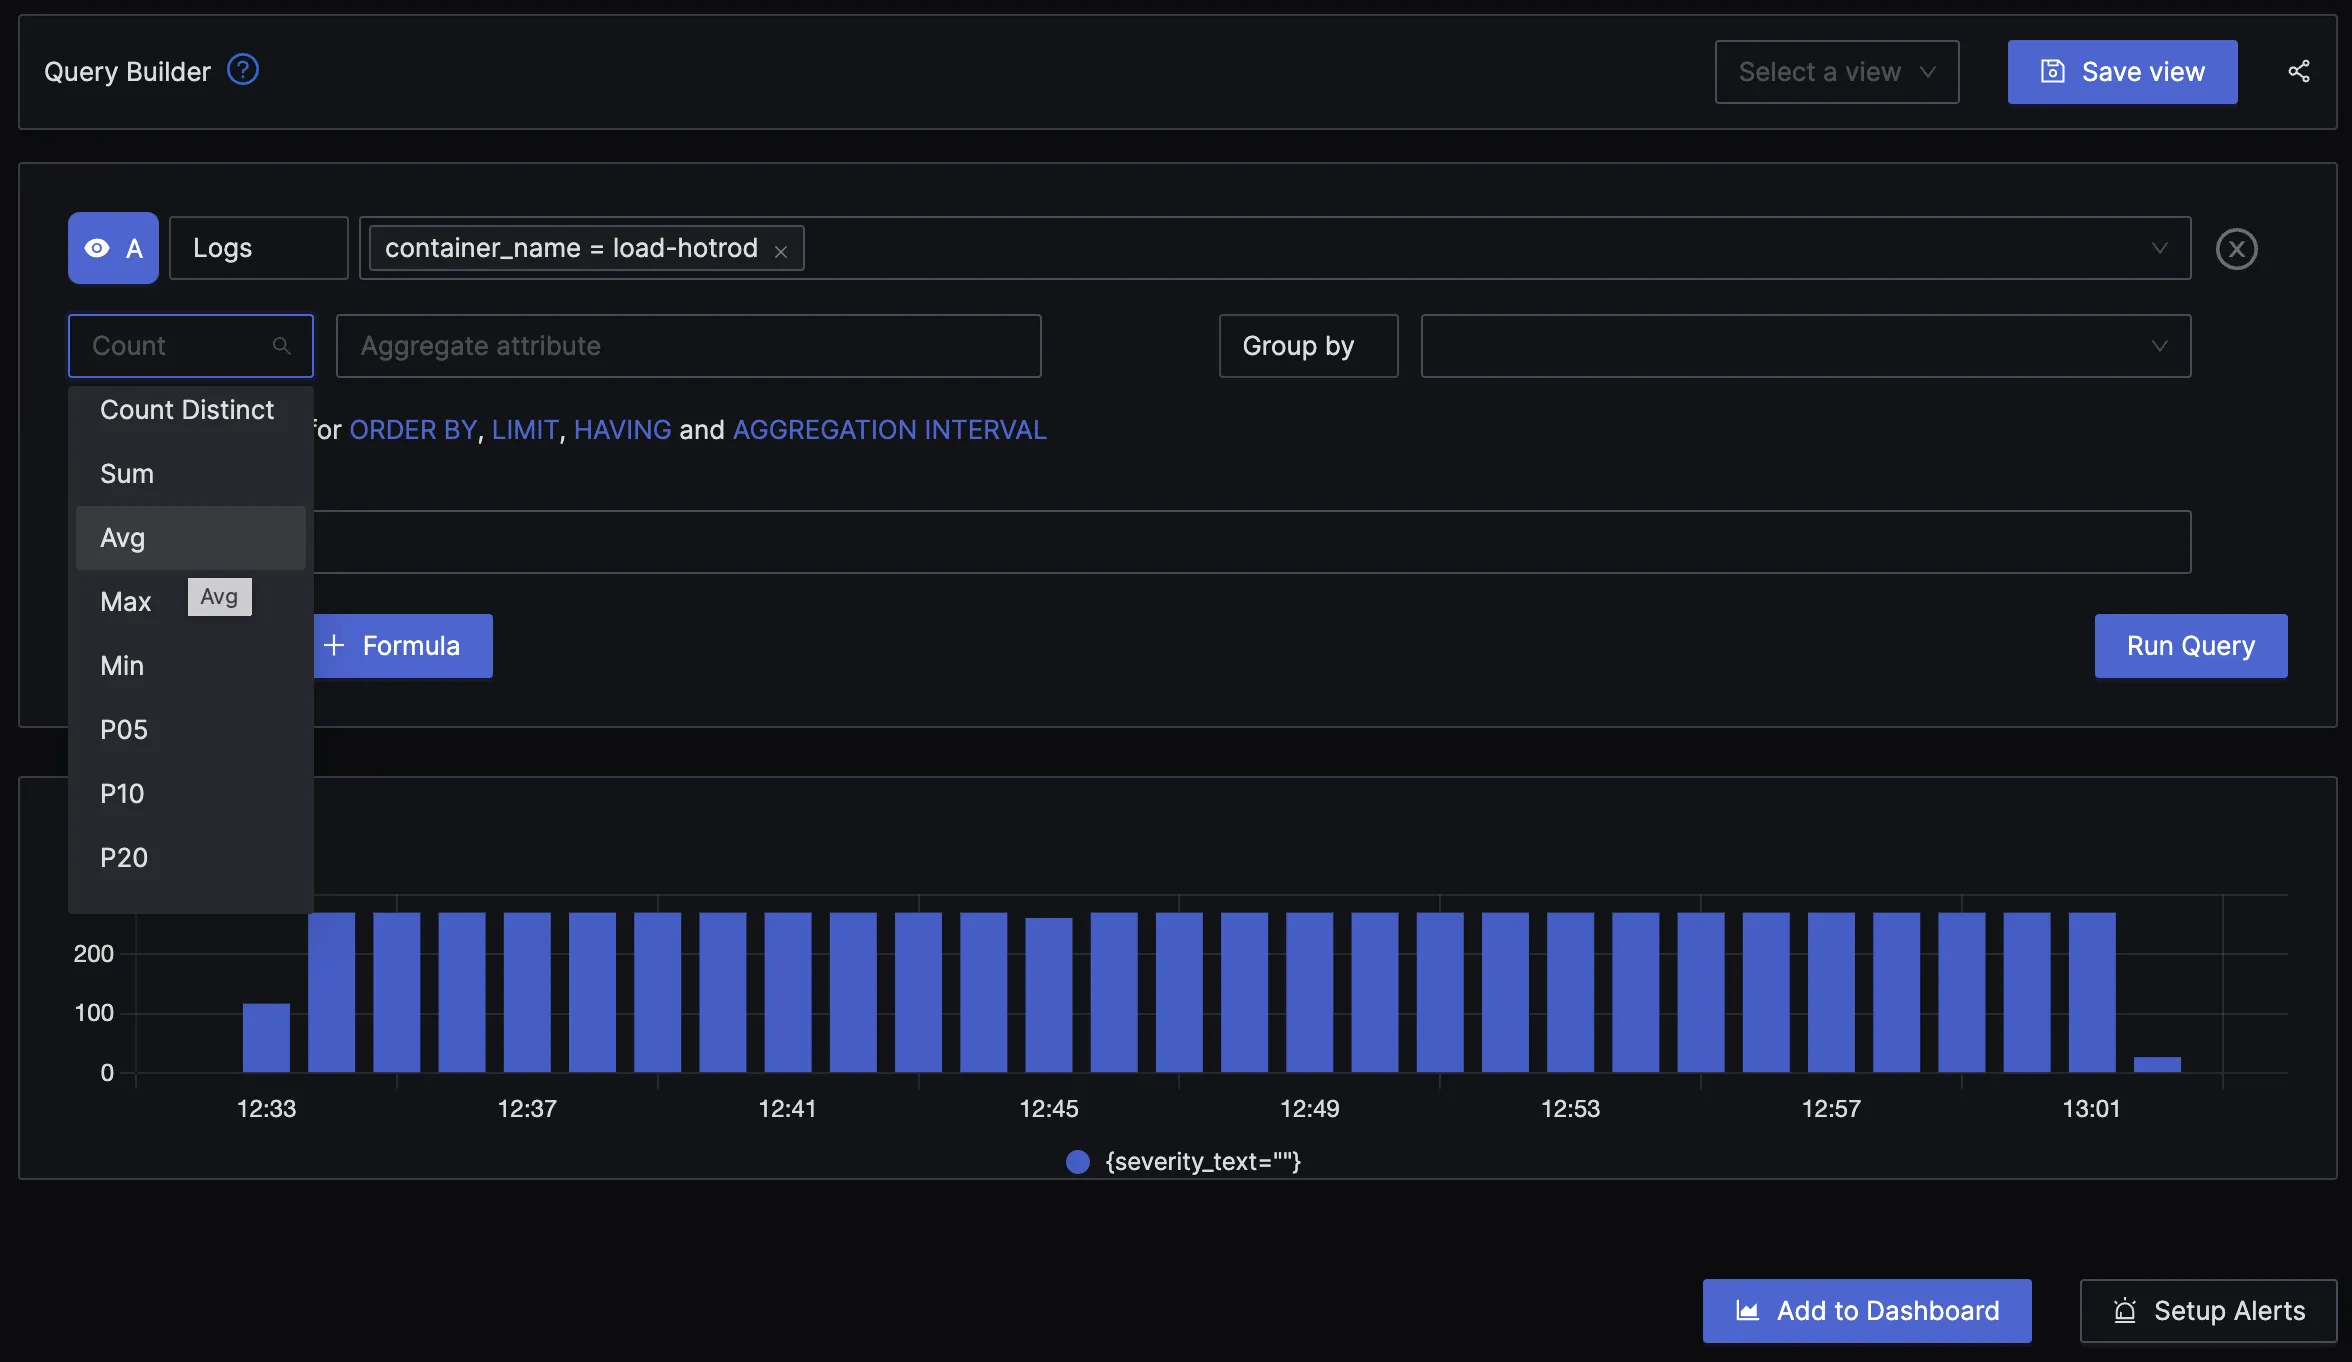
The logs tab in SigNoz has advanced features like a log query builder, search across multiple fields, structured table view, JSON view, etc.
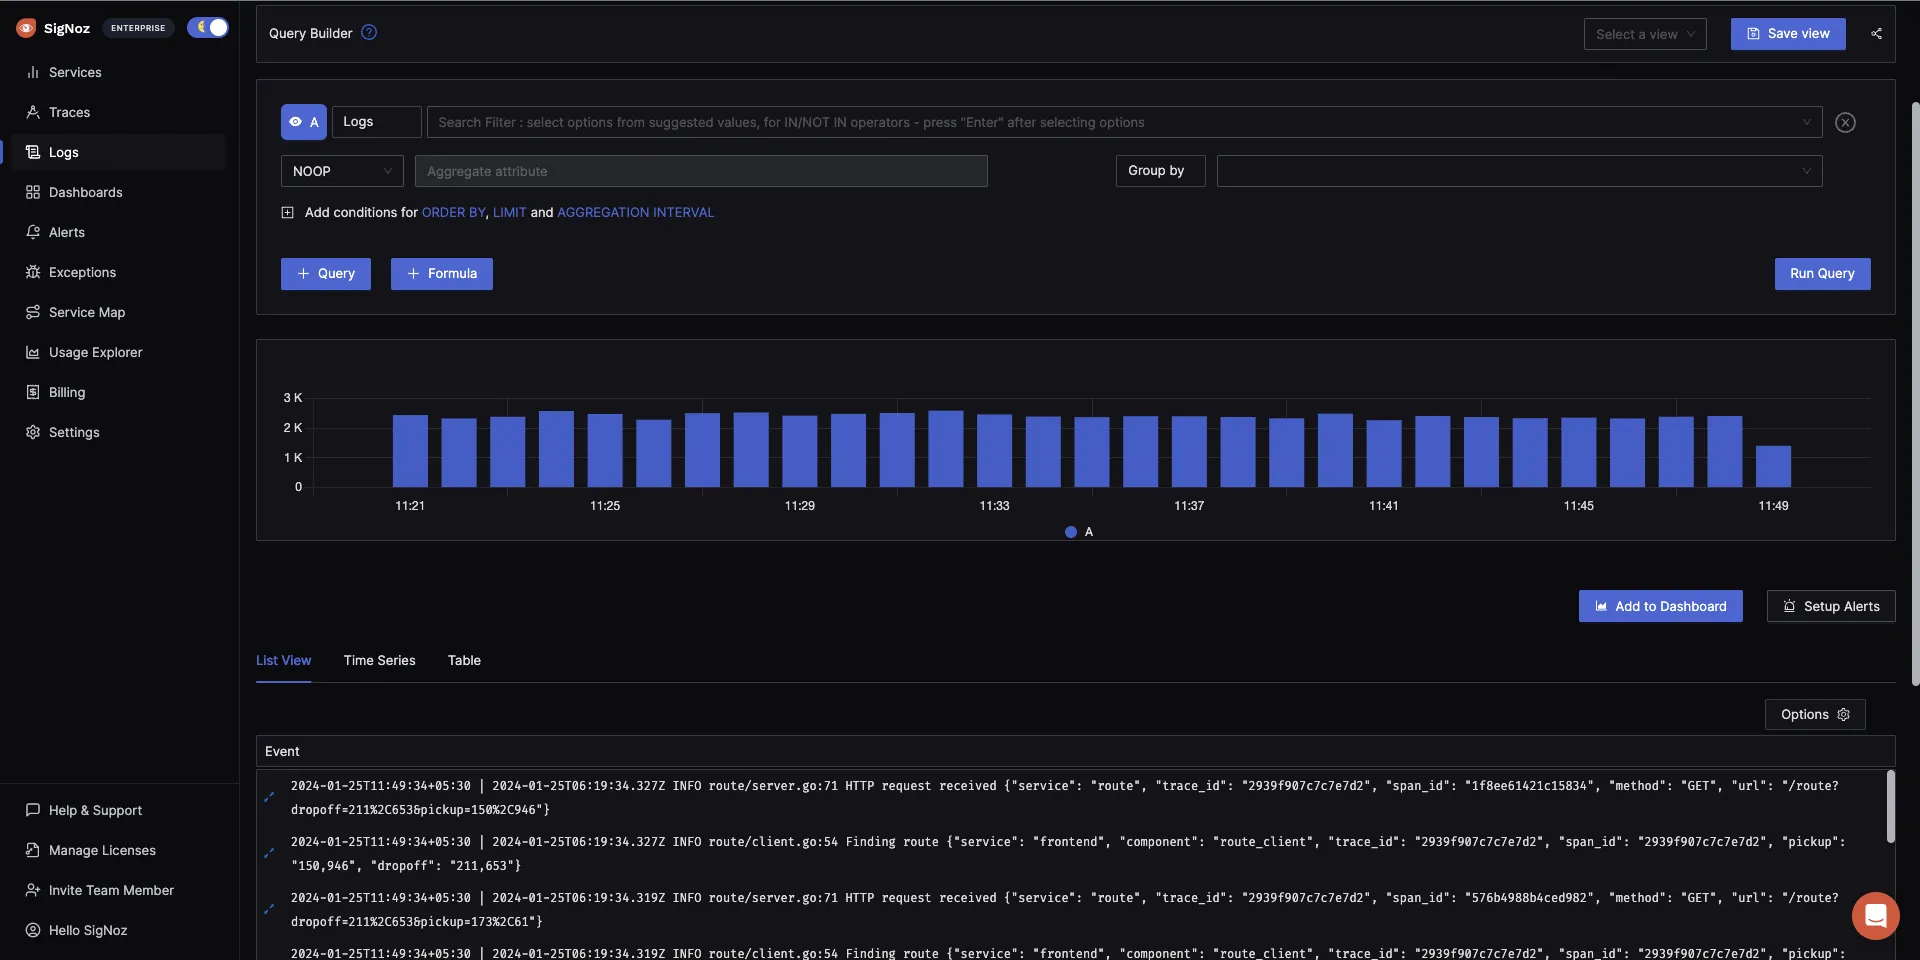
You can also view logs in real-time with live tail logging.
With advanced Log Query Builder, you can filter out logs quickly with a mix and match of fields.
Getting started with SigNoz
SigNoz cloud is the easiest way to run SigNoz. Sign up for a free account and get 30 days of unlimited access to all features.
You can also install and self-host SigNoz yourself since it is open-source. With 19,000+ GitHub stars, open-source SigNoz is loved by developers. Find the instructions to self-host SigNoz.
OpenTelemetry logs are the way forward!
The goal of OpenTelemetry is to make log data have a richer context, making it more valuable to application owners. With OpenTelemetry you can correlate logs with traces and correlate logs emitted by different components of a distributed system.
Standardizing log correlation with traces and metrics, adding support for distributed context propagation for logs, unification of source attribution of logs, traces and metrics will increase the individual and combined value of observability information for legacy and modern systems.
Source: OpenTelemetry website
To get started with OpenTelemetry logs, install SigNoz and start experimenting by sending some log data to SigNoz. SigNoz also provides traces and metrics. So you can have all three telemetry signals under a single pane of glass.
Related Posts


