Hostmetrics Dashboard
Overview
The Host Metrics dashboard consists of charts for monitoring instance metrics and is designed as a generic dashboard with a hostname variable. You can access detailed information on common host system metrics such as:
- CPU Usage
- Memory Usage
- Disk I/O
- Filesystem Usage
- Network I/O
A full list of supported hostmetrics can be found here.
Setup
You can choose from the two options below.
A receiver serves as the entry point for data into the OpenTelemetry Collector. The Host Metrics receiver collects metrics about the host system from various sources, such as files located in paths like /sys/block/sda/size and /proc/... on the host machine. It reads and formats the data from these sources into an OTLP-compatible format. This receiver is intended to be used when the OpenTelemetry Collector is deployed as an agent.
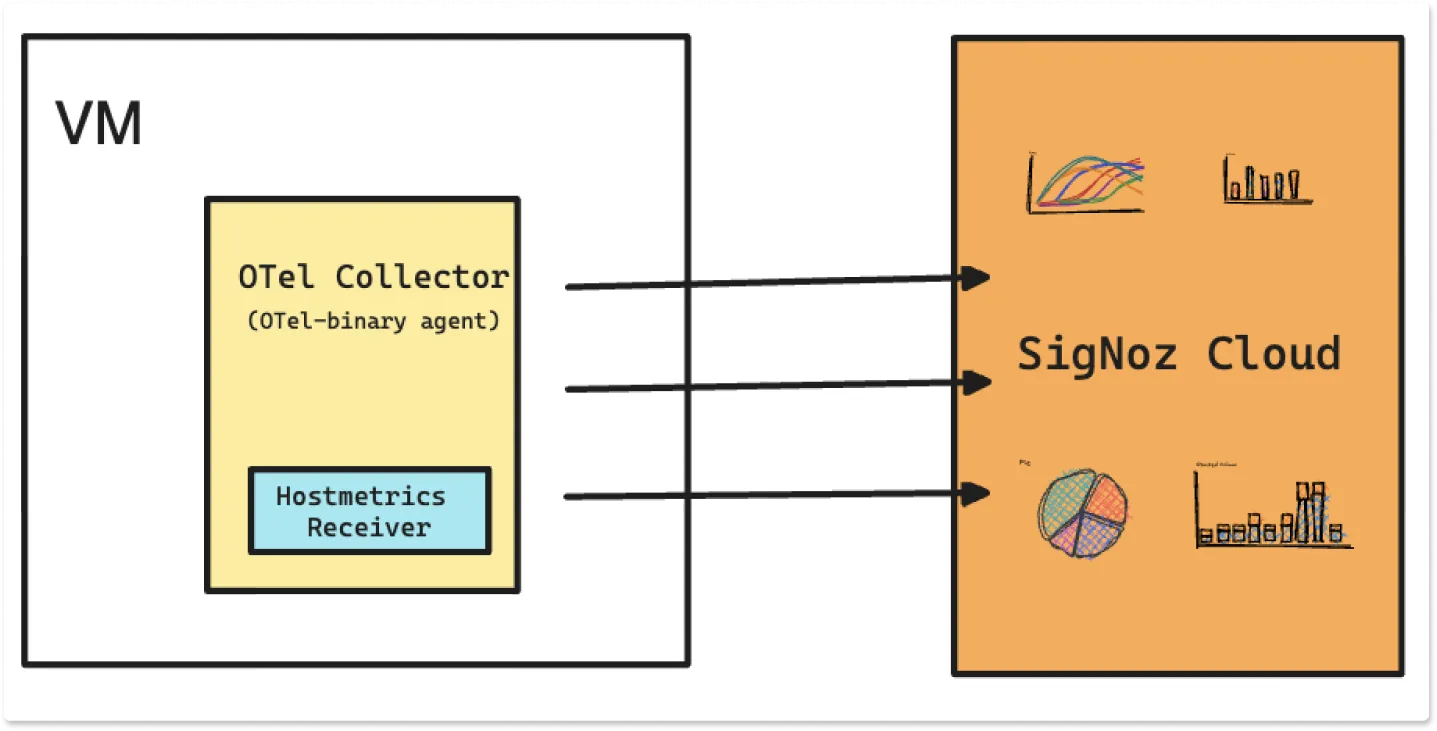
Follow the below steps to set up the HostMetrics Dashboard on the SigNoz UI.
Step 1 : Setup OTel Collector as an agent
Follow the steps in SigNoz Cloud section of this tutorial to get your Otel Collector agent up and running.
Step 2 : Download/Copy the hostmetrics JSON file
Hostmetric JSON file will help you create a pre-built dashboard about all the categories of host metrics provided by hostmetrics receiver.
Use this GitHub Link to download/copy the hostmetrics.json file.
Step 3 : Import hostmetrics JSON file to SigNoz Cloud
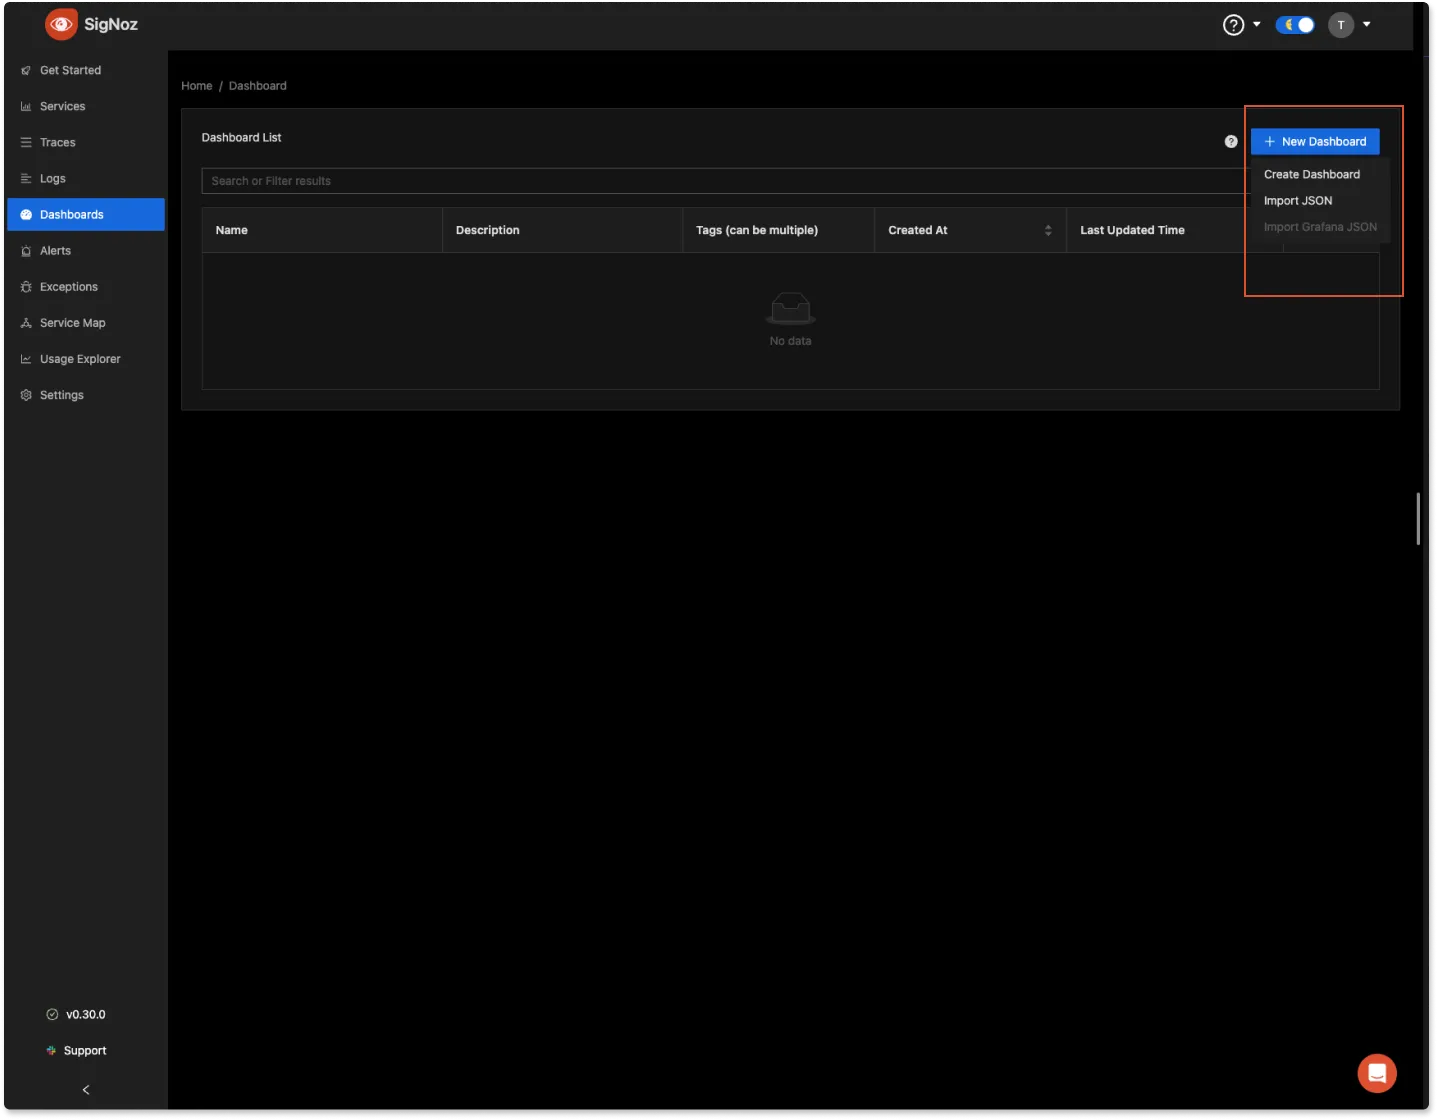
Open your SigNoz Cloud UI and go to the Dashboards section. In the top right corner, click on the + New Dashboard button and select the Import JSON option from the dropdown menu.
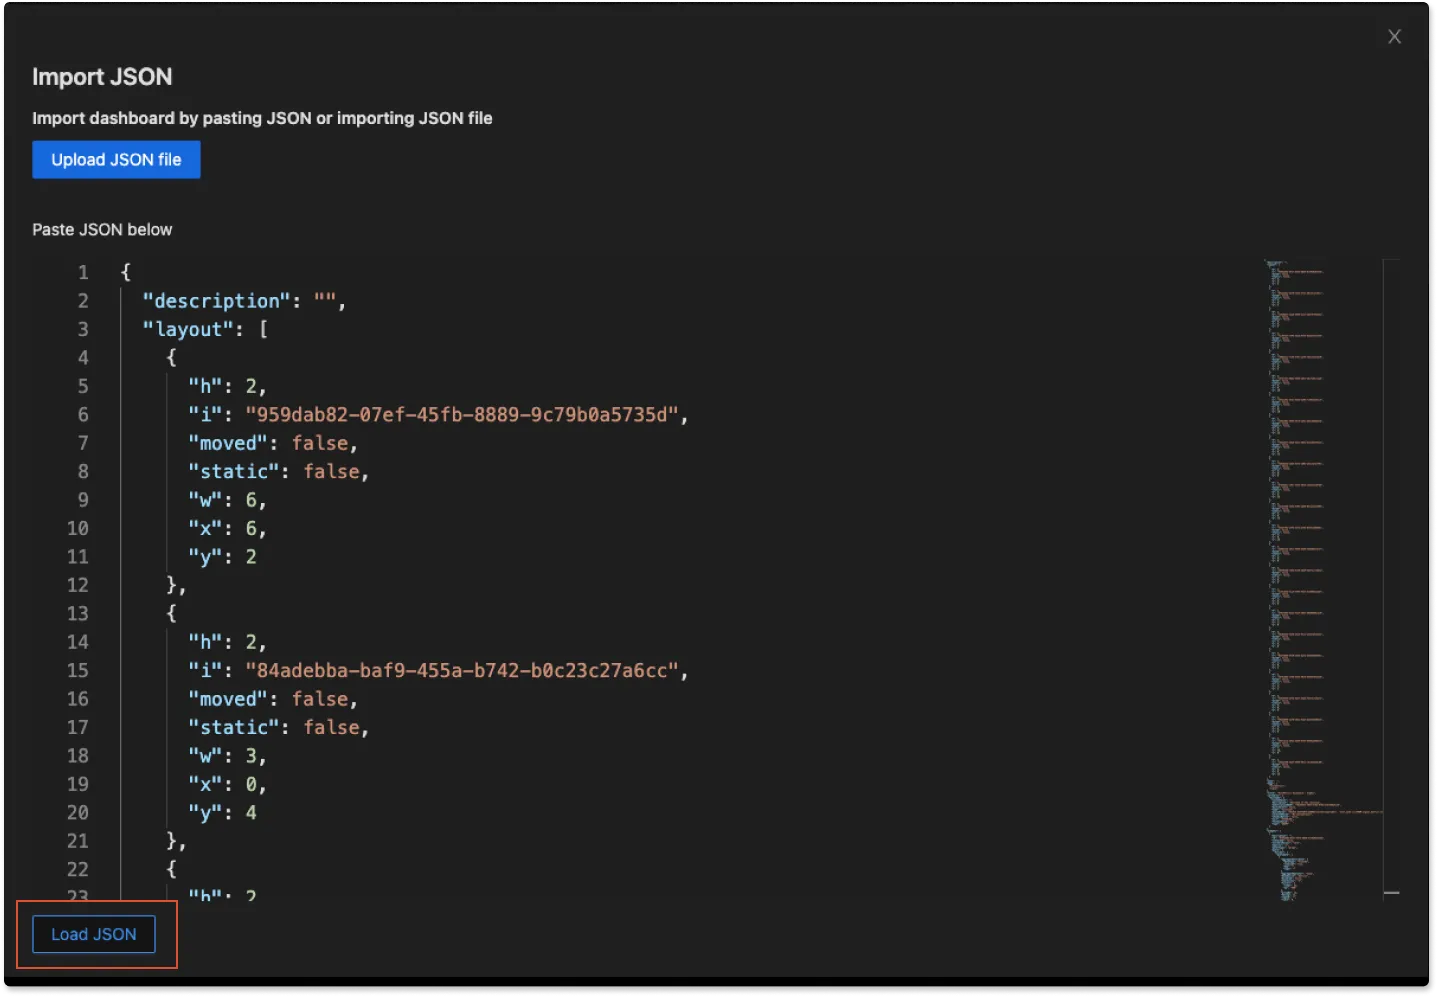
Upload/paste your hostmetrics.json data and click on Load JSON button
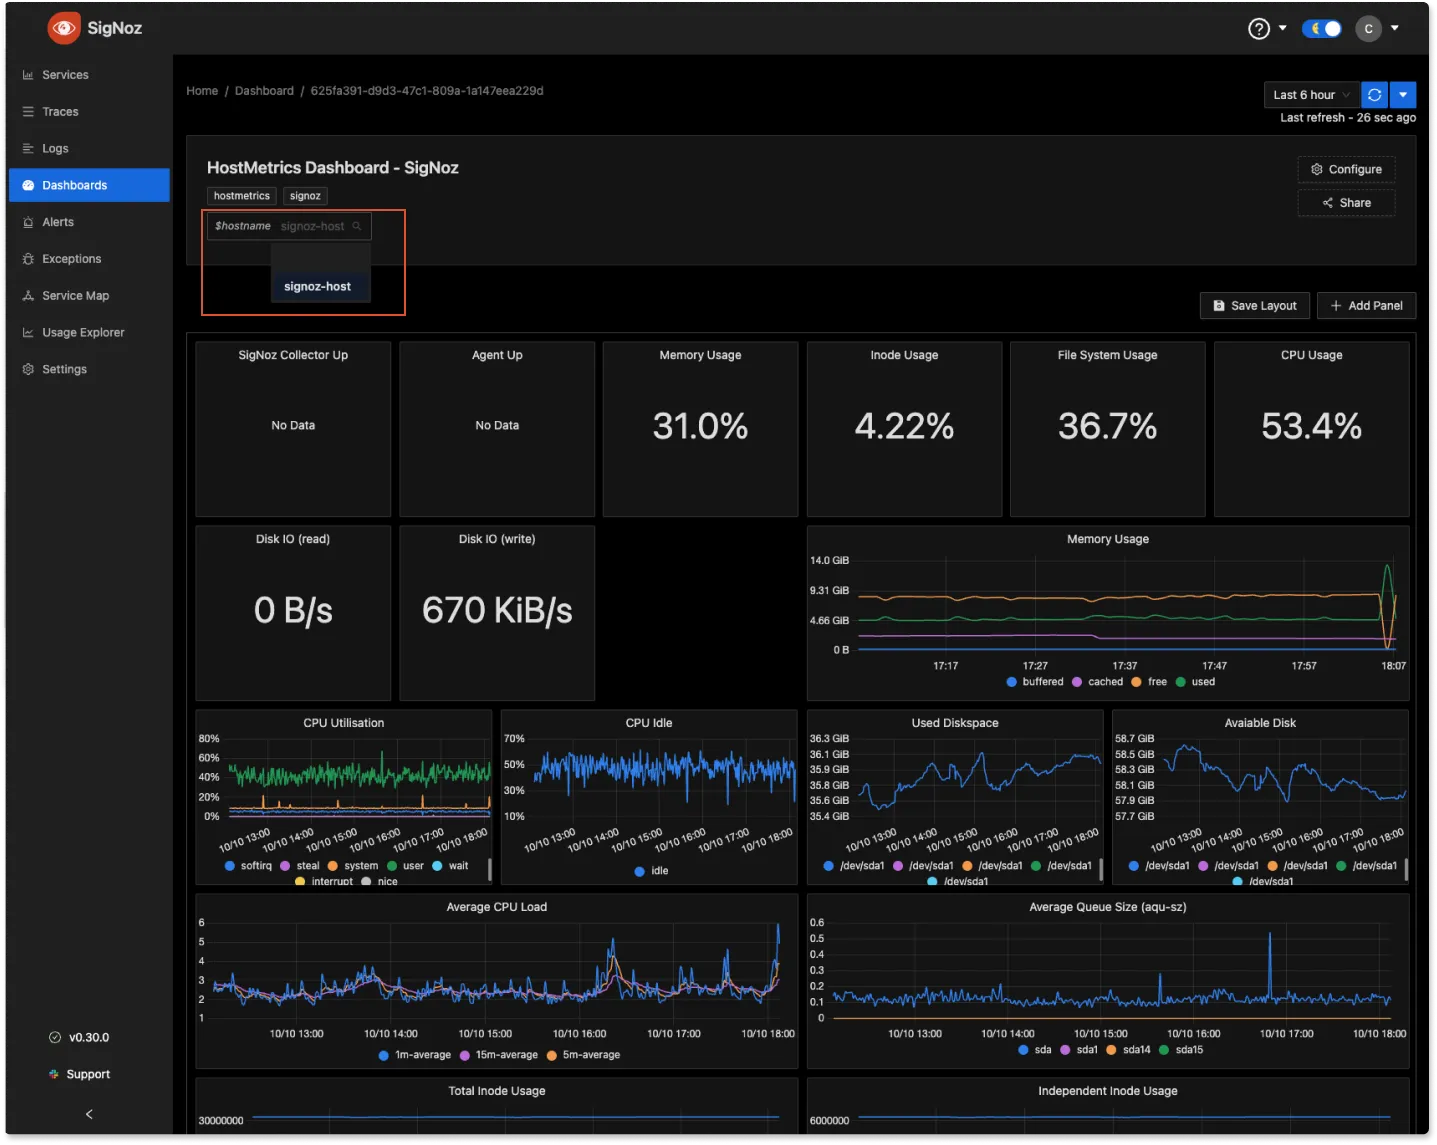
After loading the JSON, you can find your hostname in the $hostname dropdown menu. Select it, and you'll access the Hostmetrics Dashboard for the VM where you've configured the OTel collector.
Dashboard Configurations
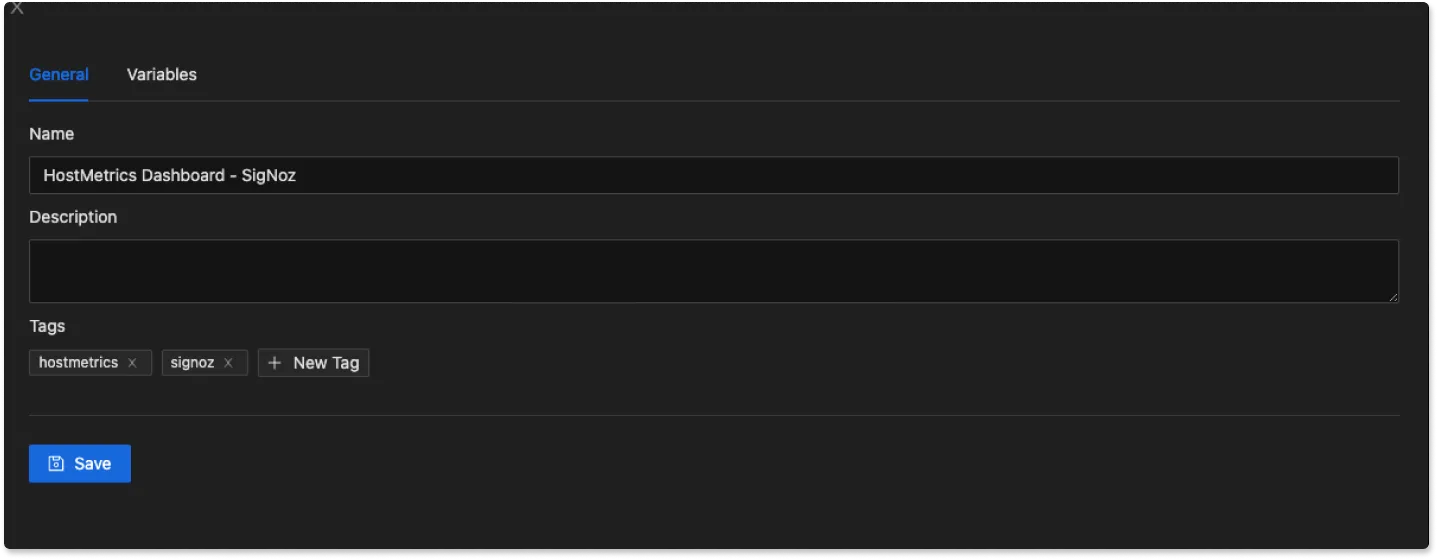
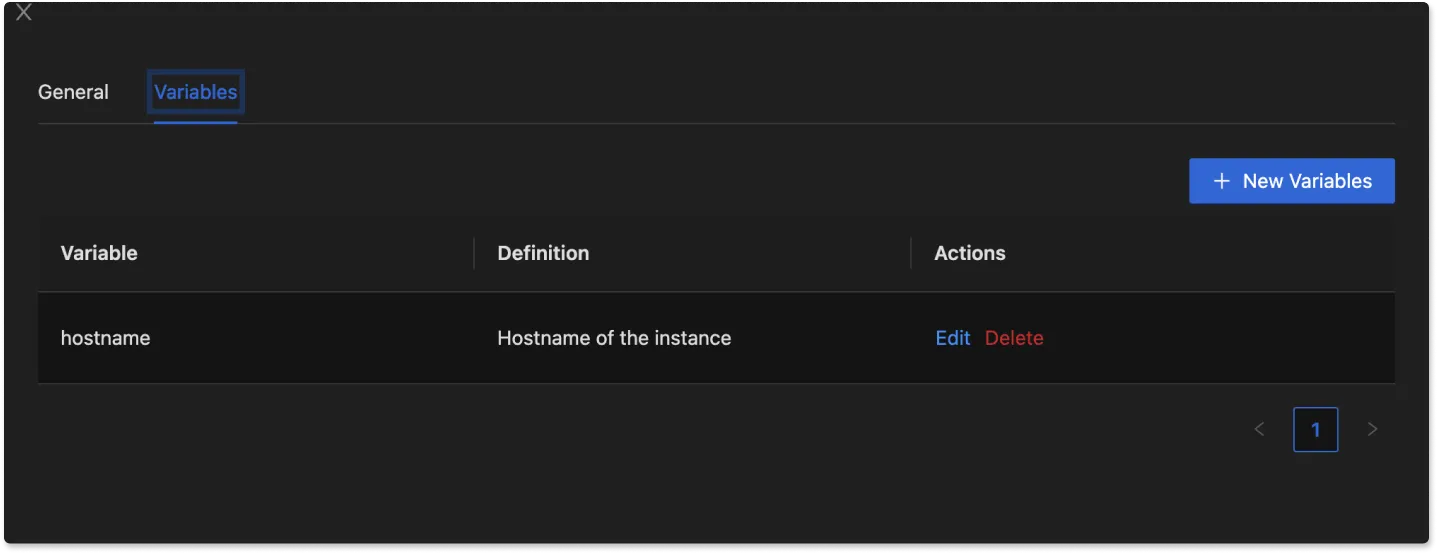
Click on Configure button at top right corner to change the name, add/remove tags, edit description, and add more variables to your dashboard.
To explore more dashboard functionalities, check out the Dashboard Section.
