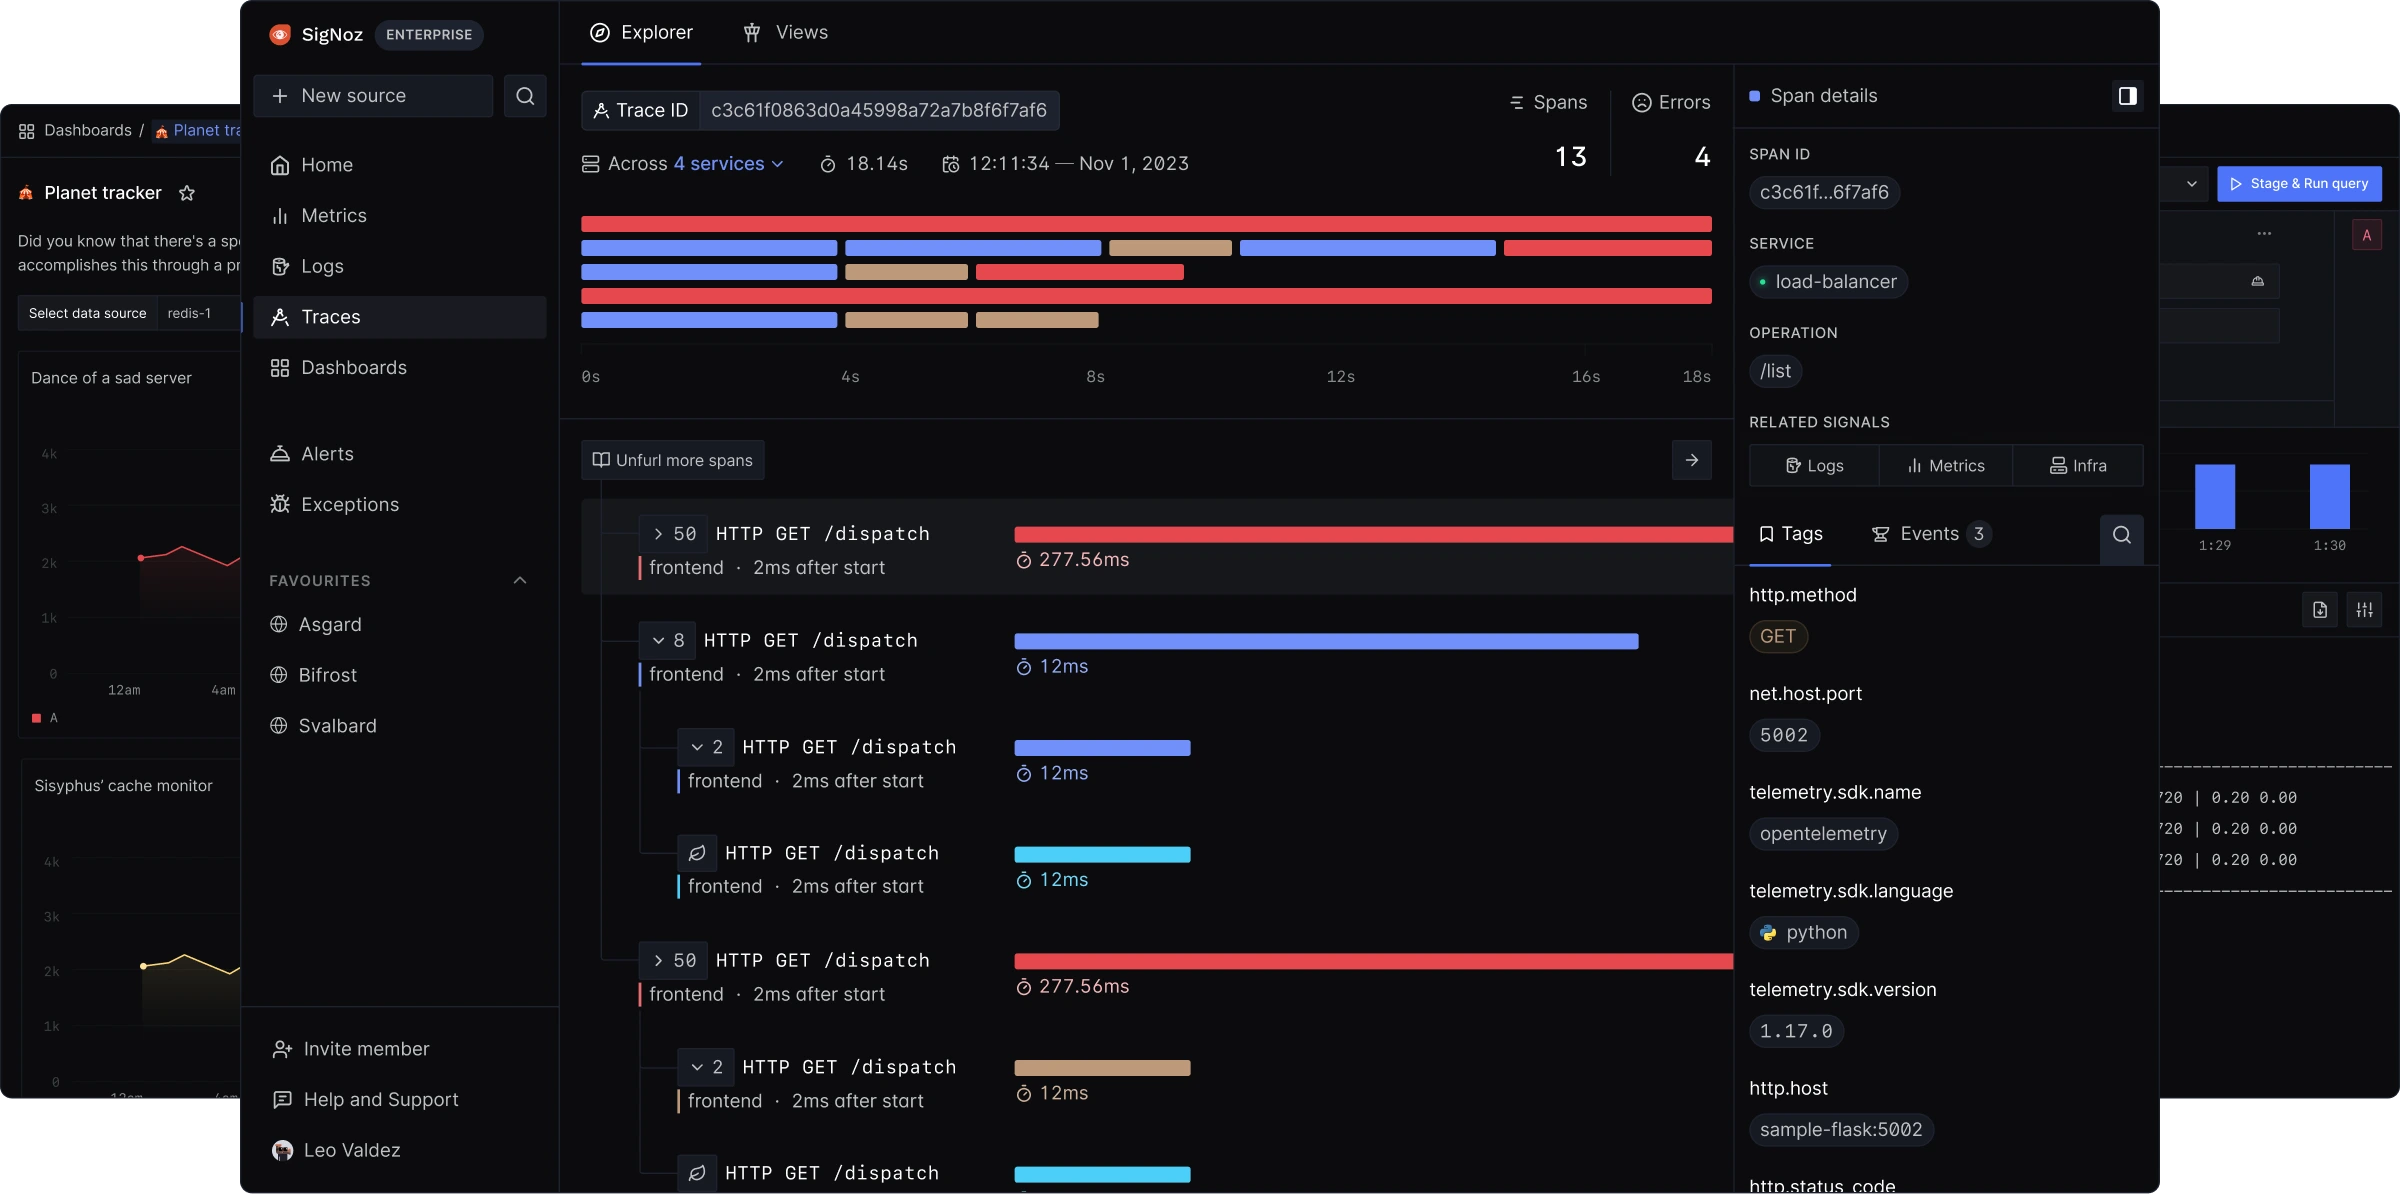
Log Management at any Scale
Powered by ClickHouse
Ingest logs from anywhere, quickly search and analyze with a powerful query builder, and correlate your
logs with other signals. Logs at SigNoz is powered by ClickHouse - a lightning-fast columnar datastore
suited for storing logs at scale.


Log Management?

Logs at any scale powered by ClickHouse
SigNoz uses ClickHouse (used by likes of Uber & Cloudflare) as datastore ⎯ an extremely fast and highly optimized storage for logs data.
It is a column-oriented database built for complex analytical queries ⎯ they are at least 1000 times faster in processing most queries. Aggregation and filtering are lightning-fast on log data. For ingestion, we found SigNoz to be 2.5x faster than ELK and about 13 times faster than ELK for aggregation queries. (Logs Perf Benchmark).
Fast troubleshooting with Query Builder
Query your logs quickly with our powerful logs query builder. No need to learn any complex query language, just select some dropdowns and hit Run.
Get a list of common filters for your logs data and quickly filter your required logs. Apply various aggregations, such as count, sum, and average, and group your log data based on selected attributes. Utilize multiple queries and formulas to dive deeper into your logs data and uncover valuable insights.

Cost-effective long-term storage of logs
You can store your logs in long-term storage for compliance and auditing purposes. You can either forward the logs to your own S3/ Google cloud storage or object storage in SigNoz cloud. The data is stored in ClickHouse native format and you can query it whenever you want. Log forwarding cost is only $0.25 per GB.

Identify Root Cause with Correlated Signals
We provide logs, metrics, and traces under a single pane of glass powered by OpenTelemetry SDKs.
You can correlate your logs with traces and vice-versa to gain better insights while debugging. Powered by OpenTelemetry semantic conventions, correlated signals can help you understand your applications better and identify the root cause of issues faster.
Overview
Powerful Query Builder
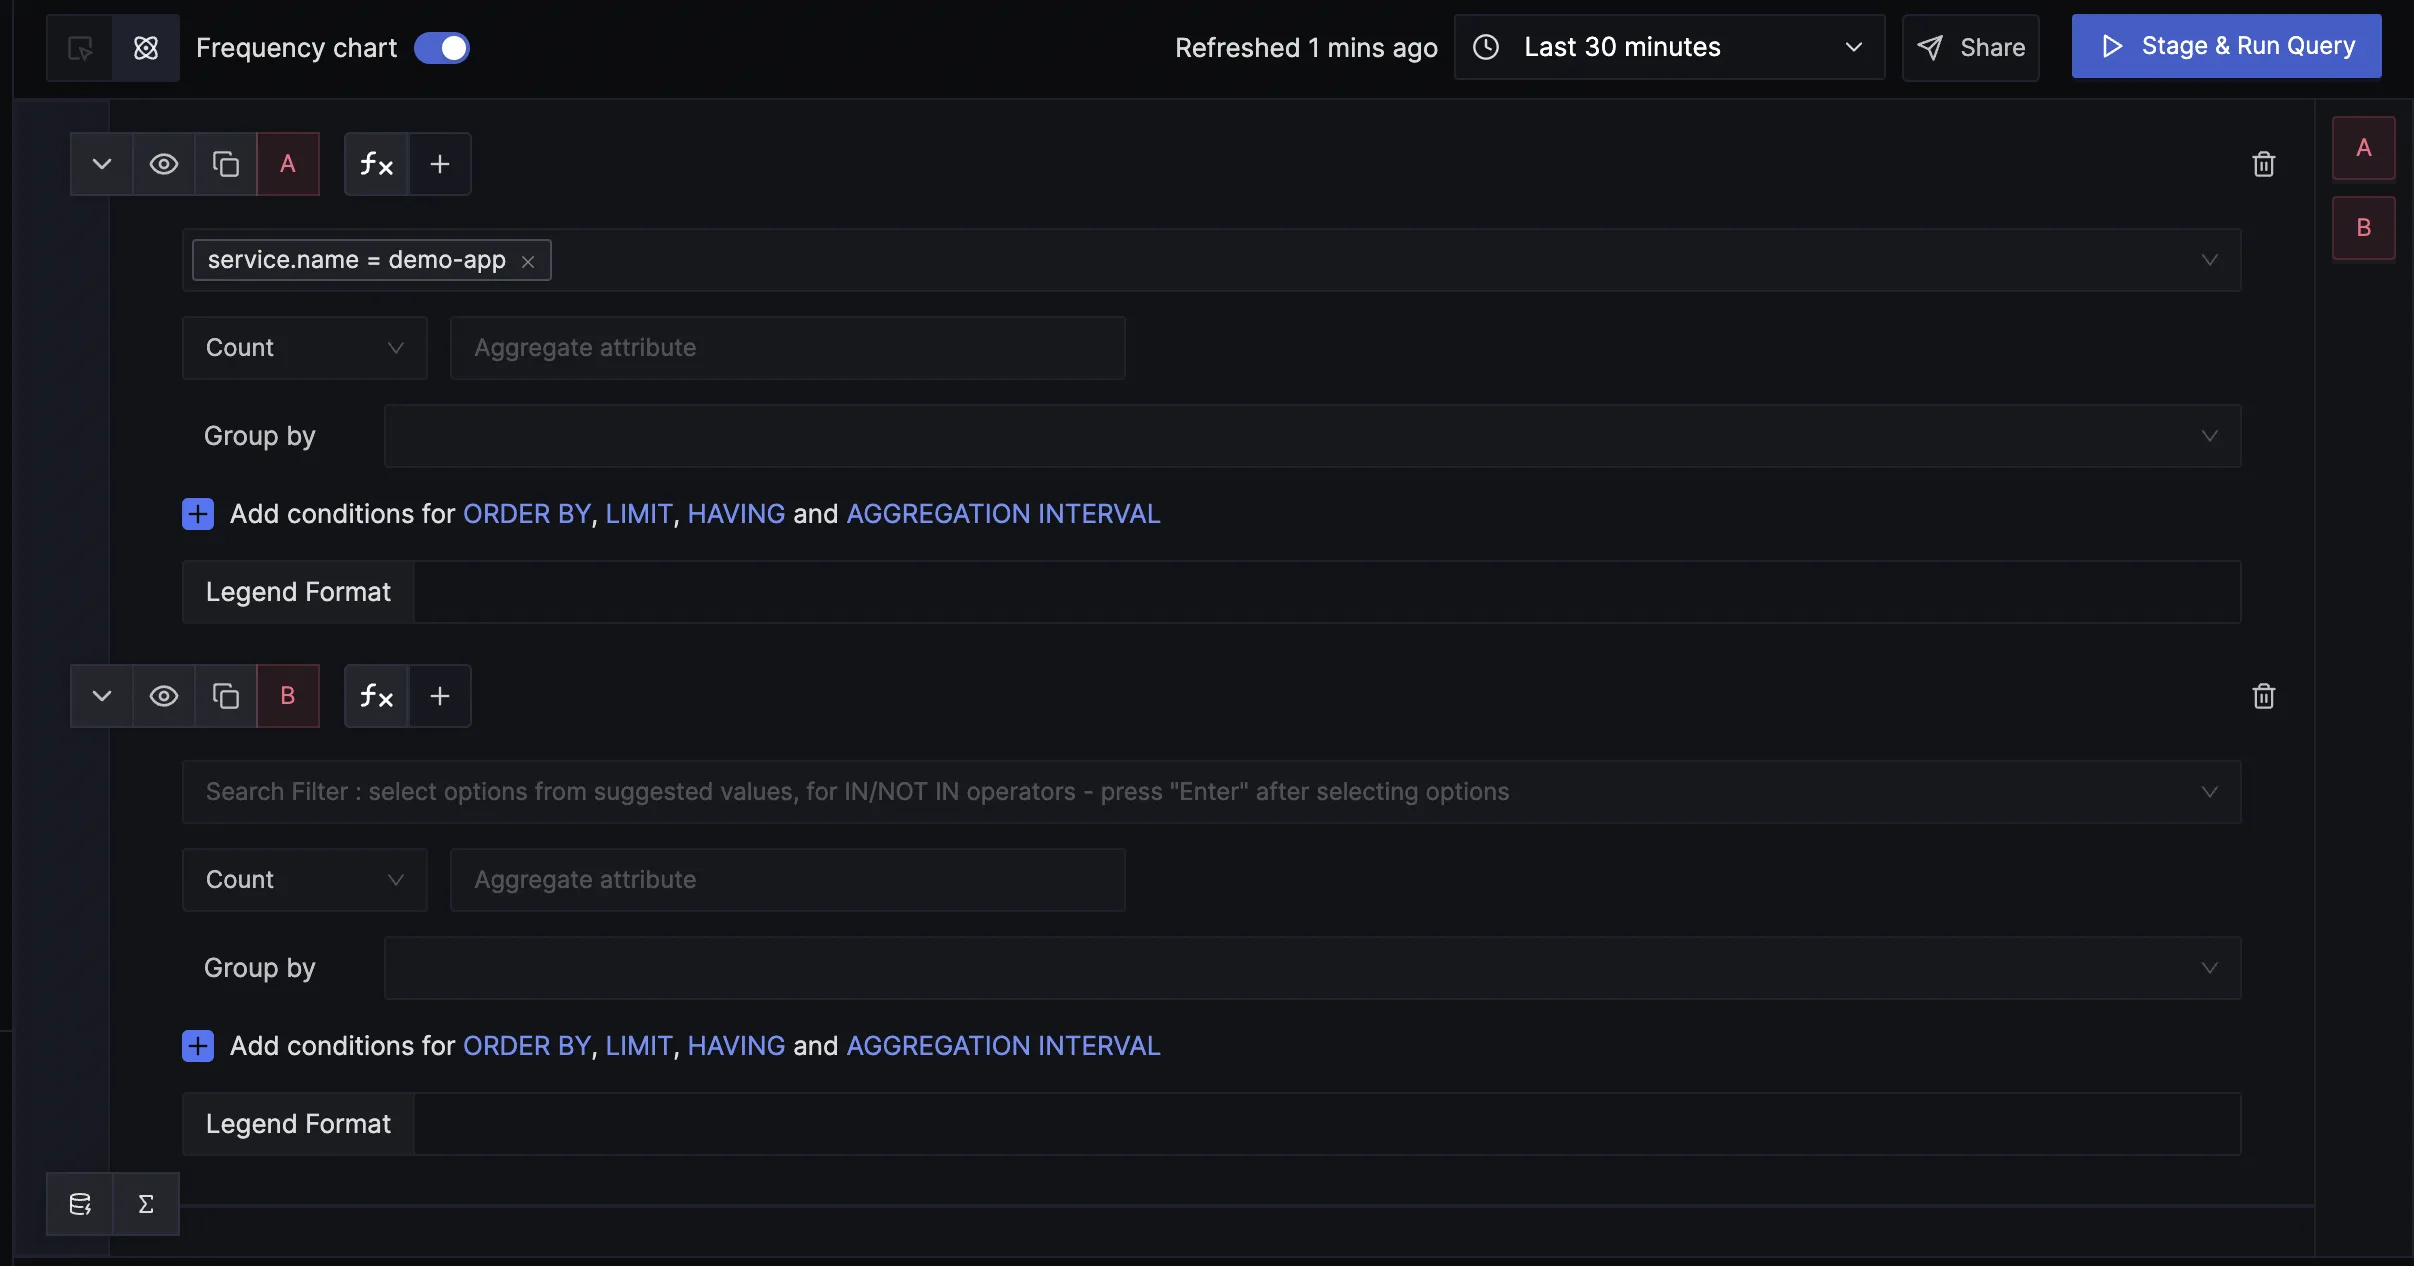
Apply various aggregations, such as count, sum, and average, and group your log data based on selected attributes. Utilize multiple queries and formulas to dive deeper into your logs data and uncover valuable insights.
Parse Logs with Log Pipelines
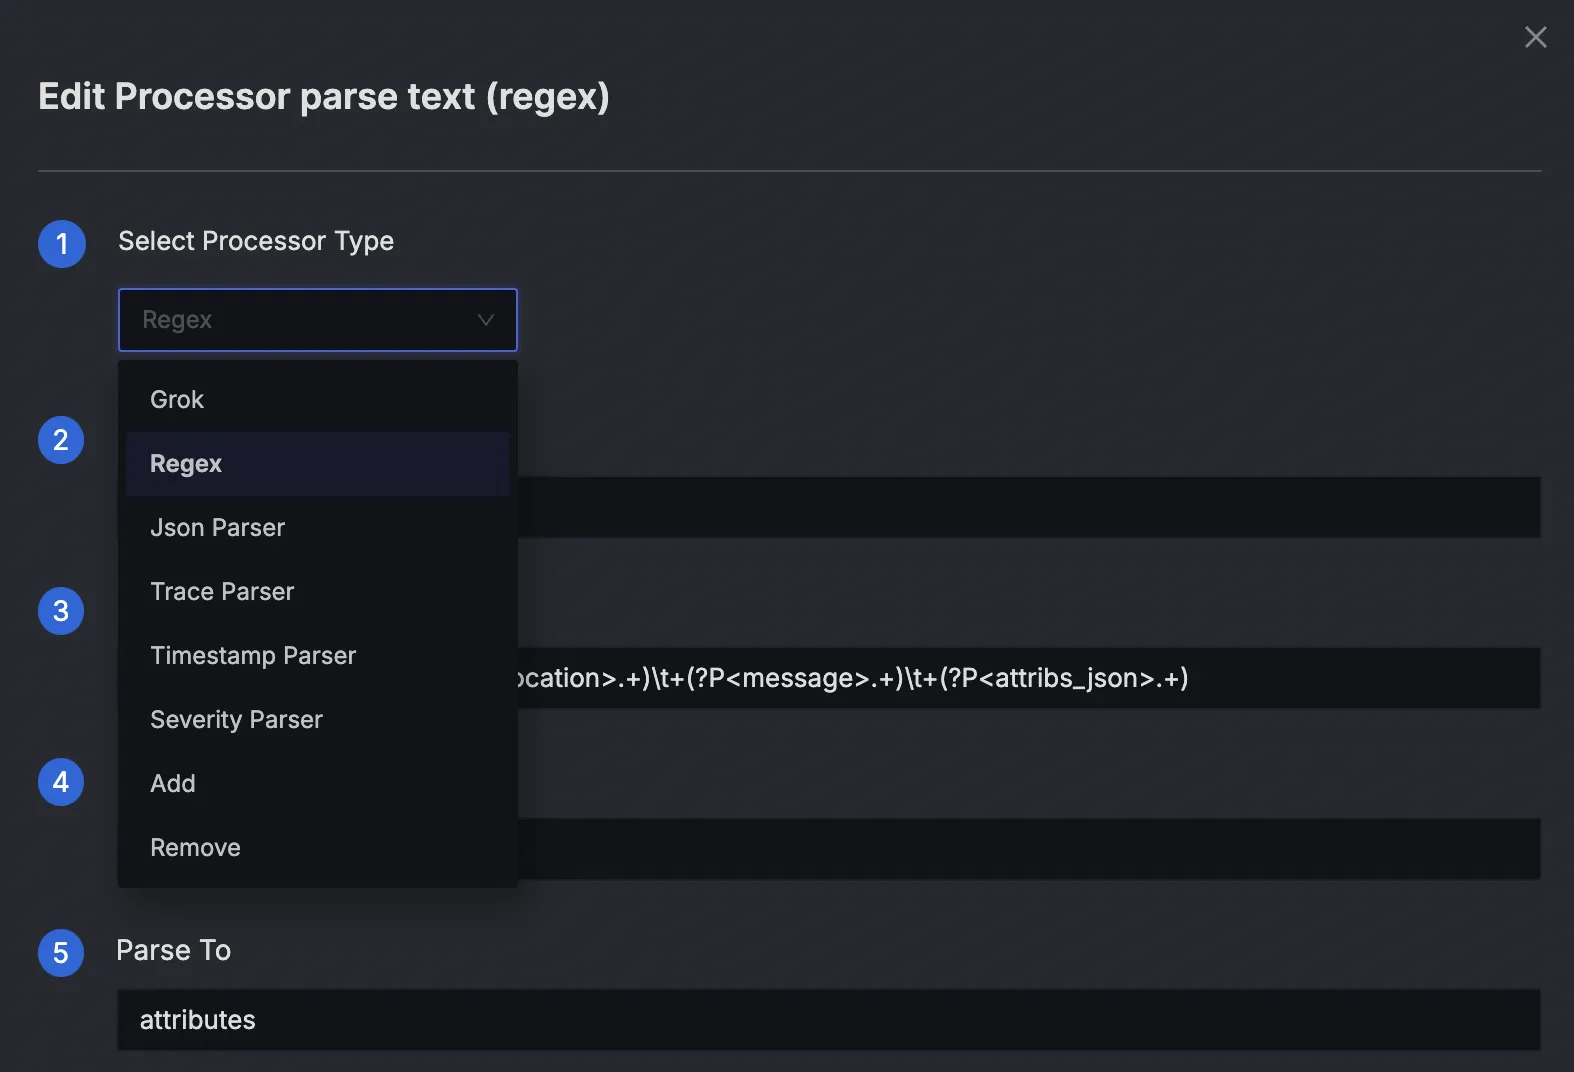
Transform logs before they get ingested to SigNoz to suit your querying and aggregation needs. Powered by OpenTelemetry Opamp, log pipelines enable you to unleash the full potential of your logs by pre-processing them to suit your needs before they get stored. This unlocks valuable logs based queries and dashboards that wouldn't be possible otherwise.
Quick Search & Filter

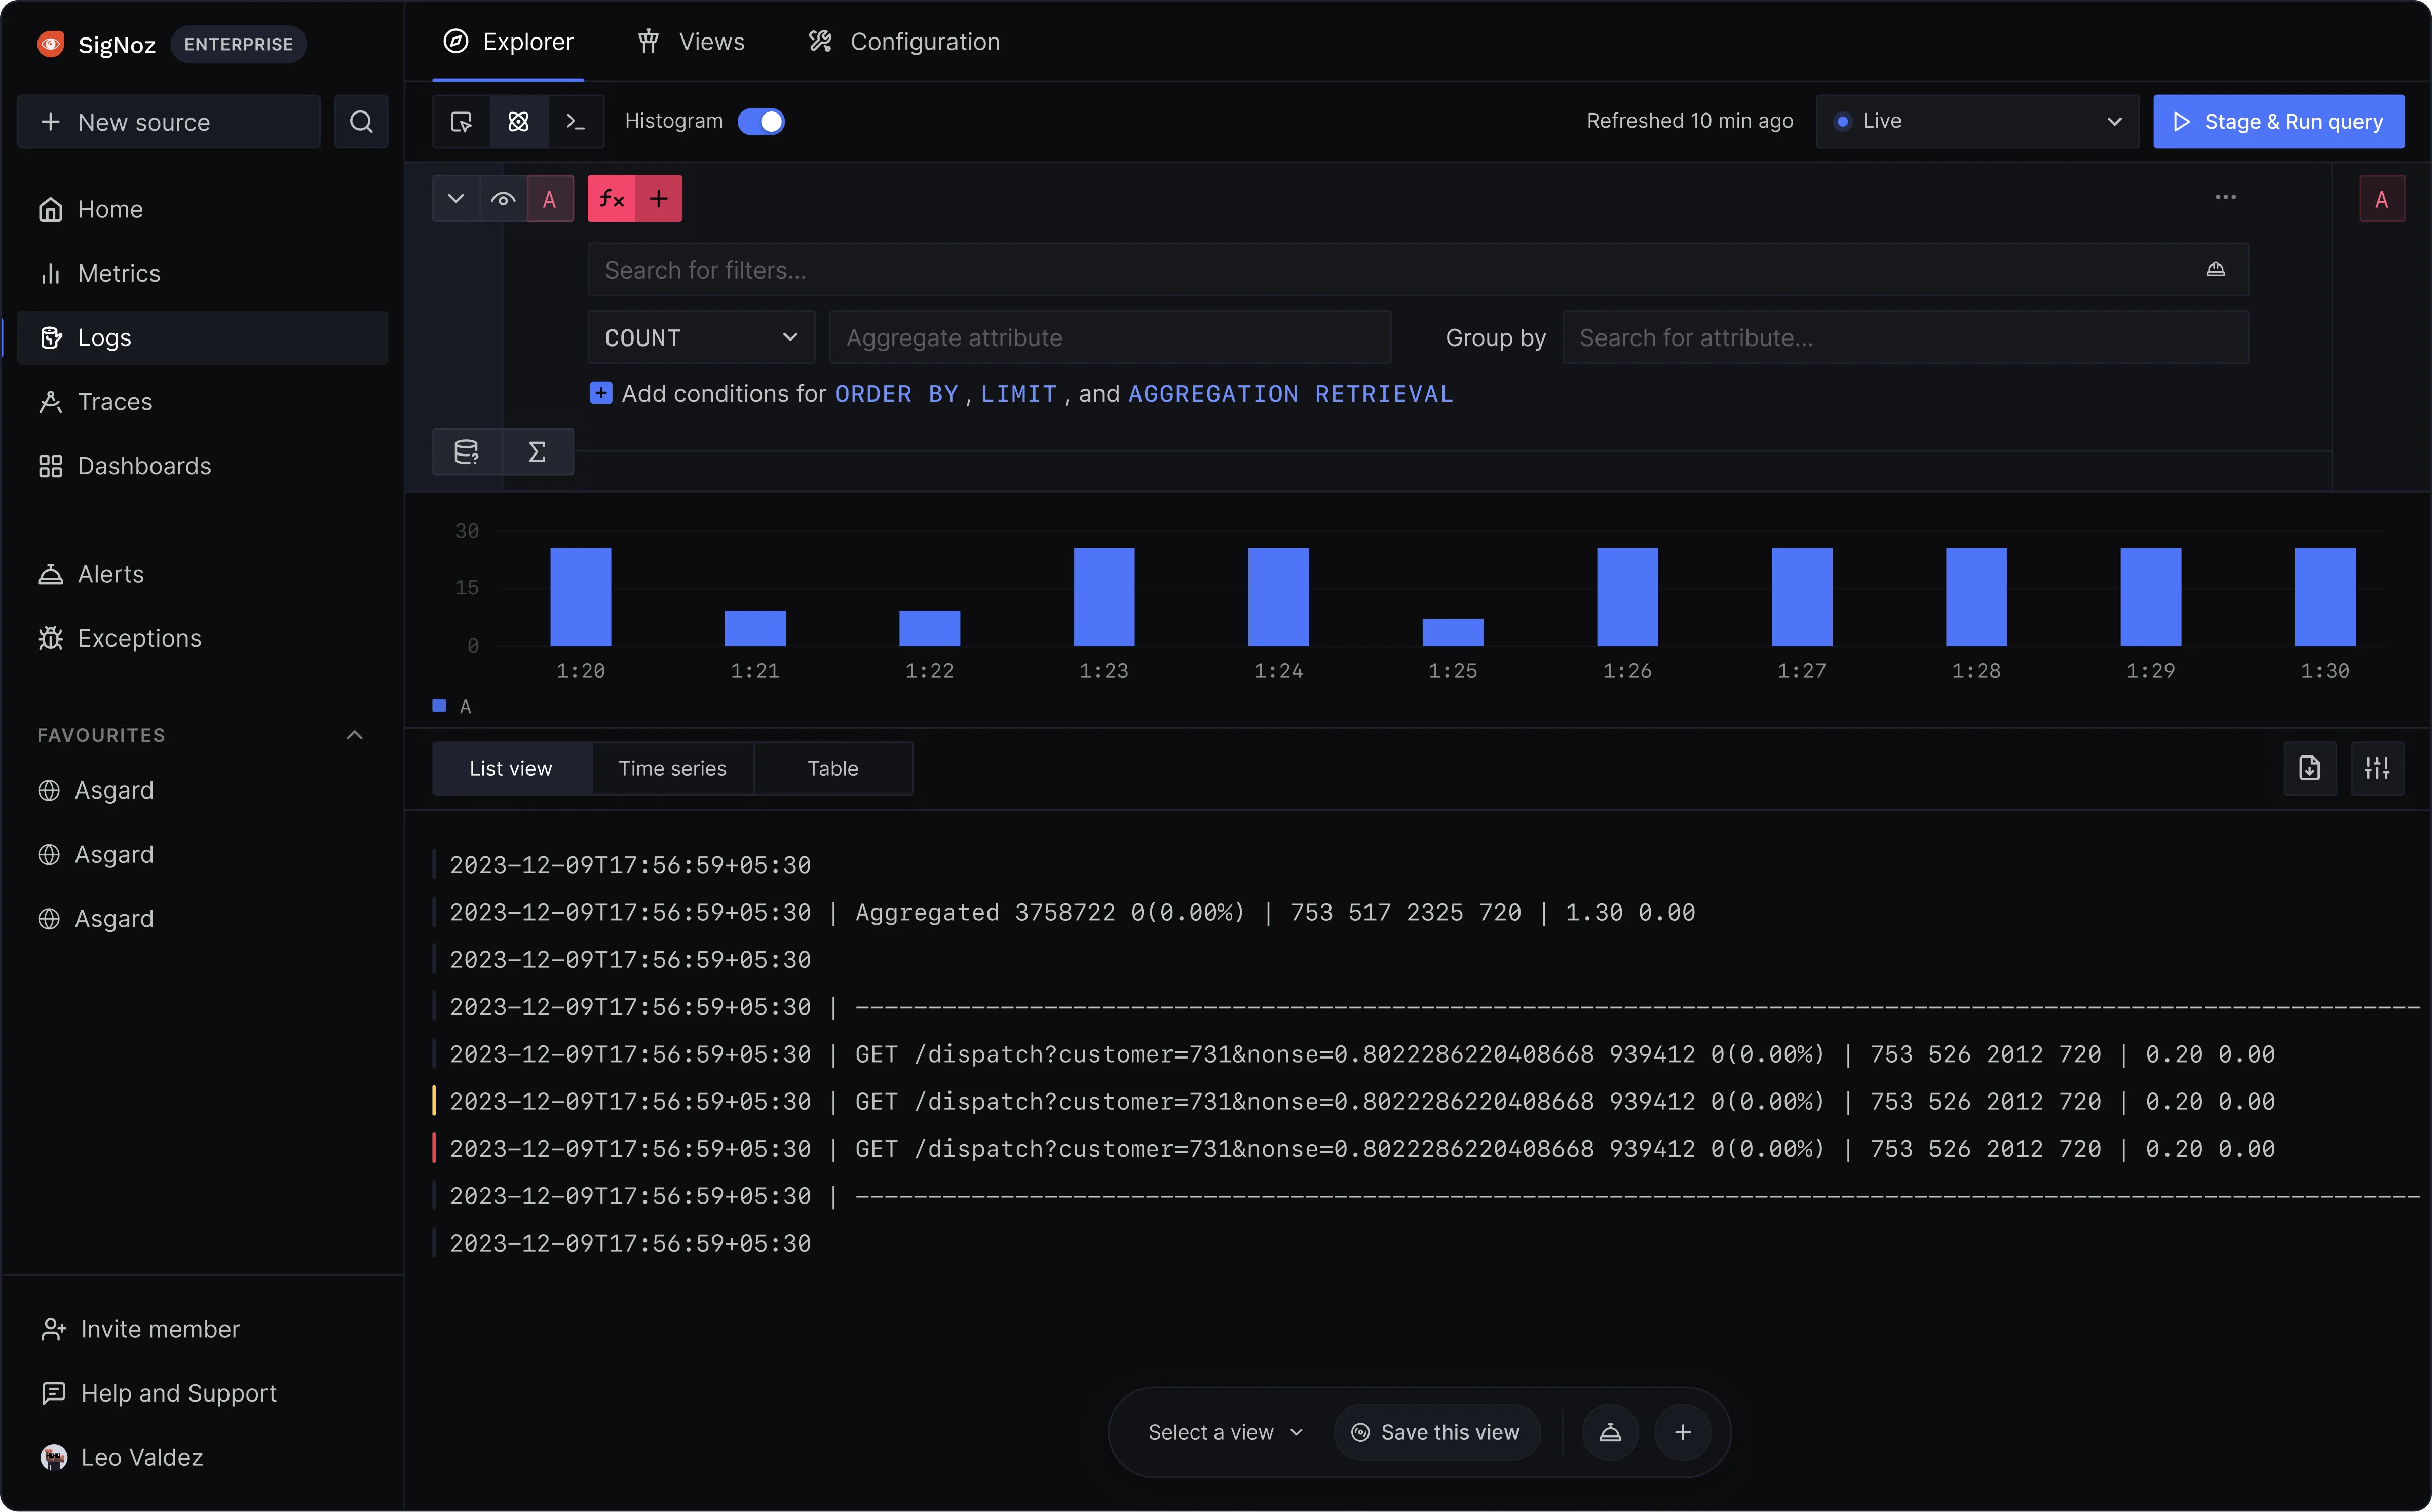
Get a list of common filters for your logs data and quickly filter your required logs with operators like conatins, in, not_in, like, not_like, etc.
Log Visualizations
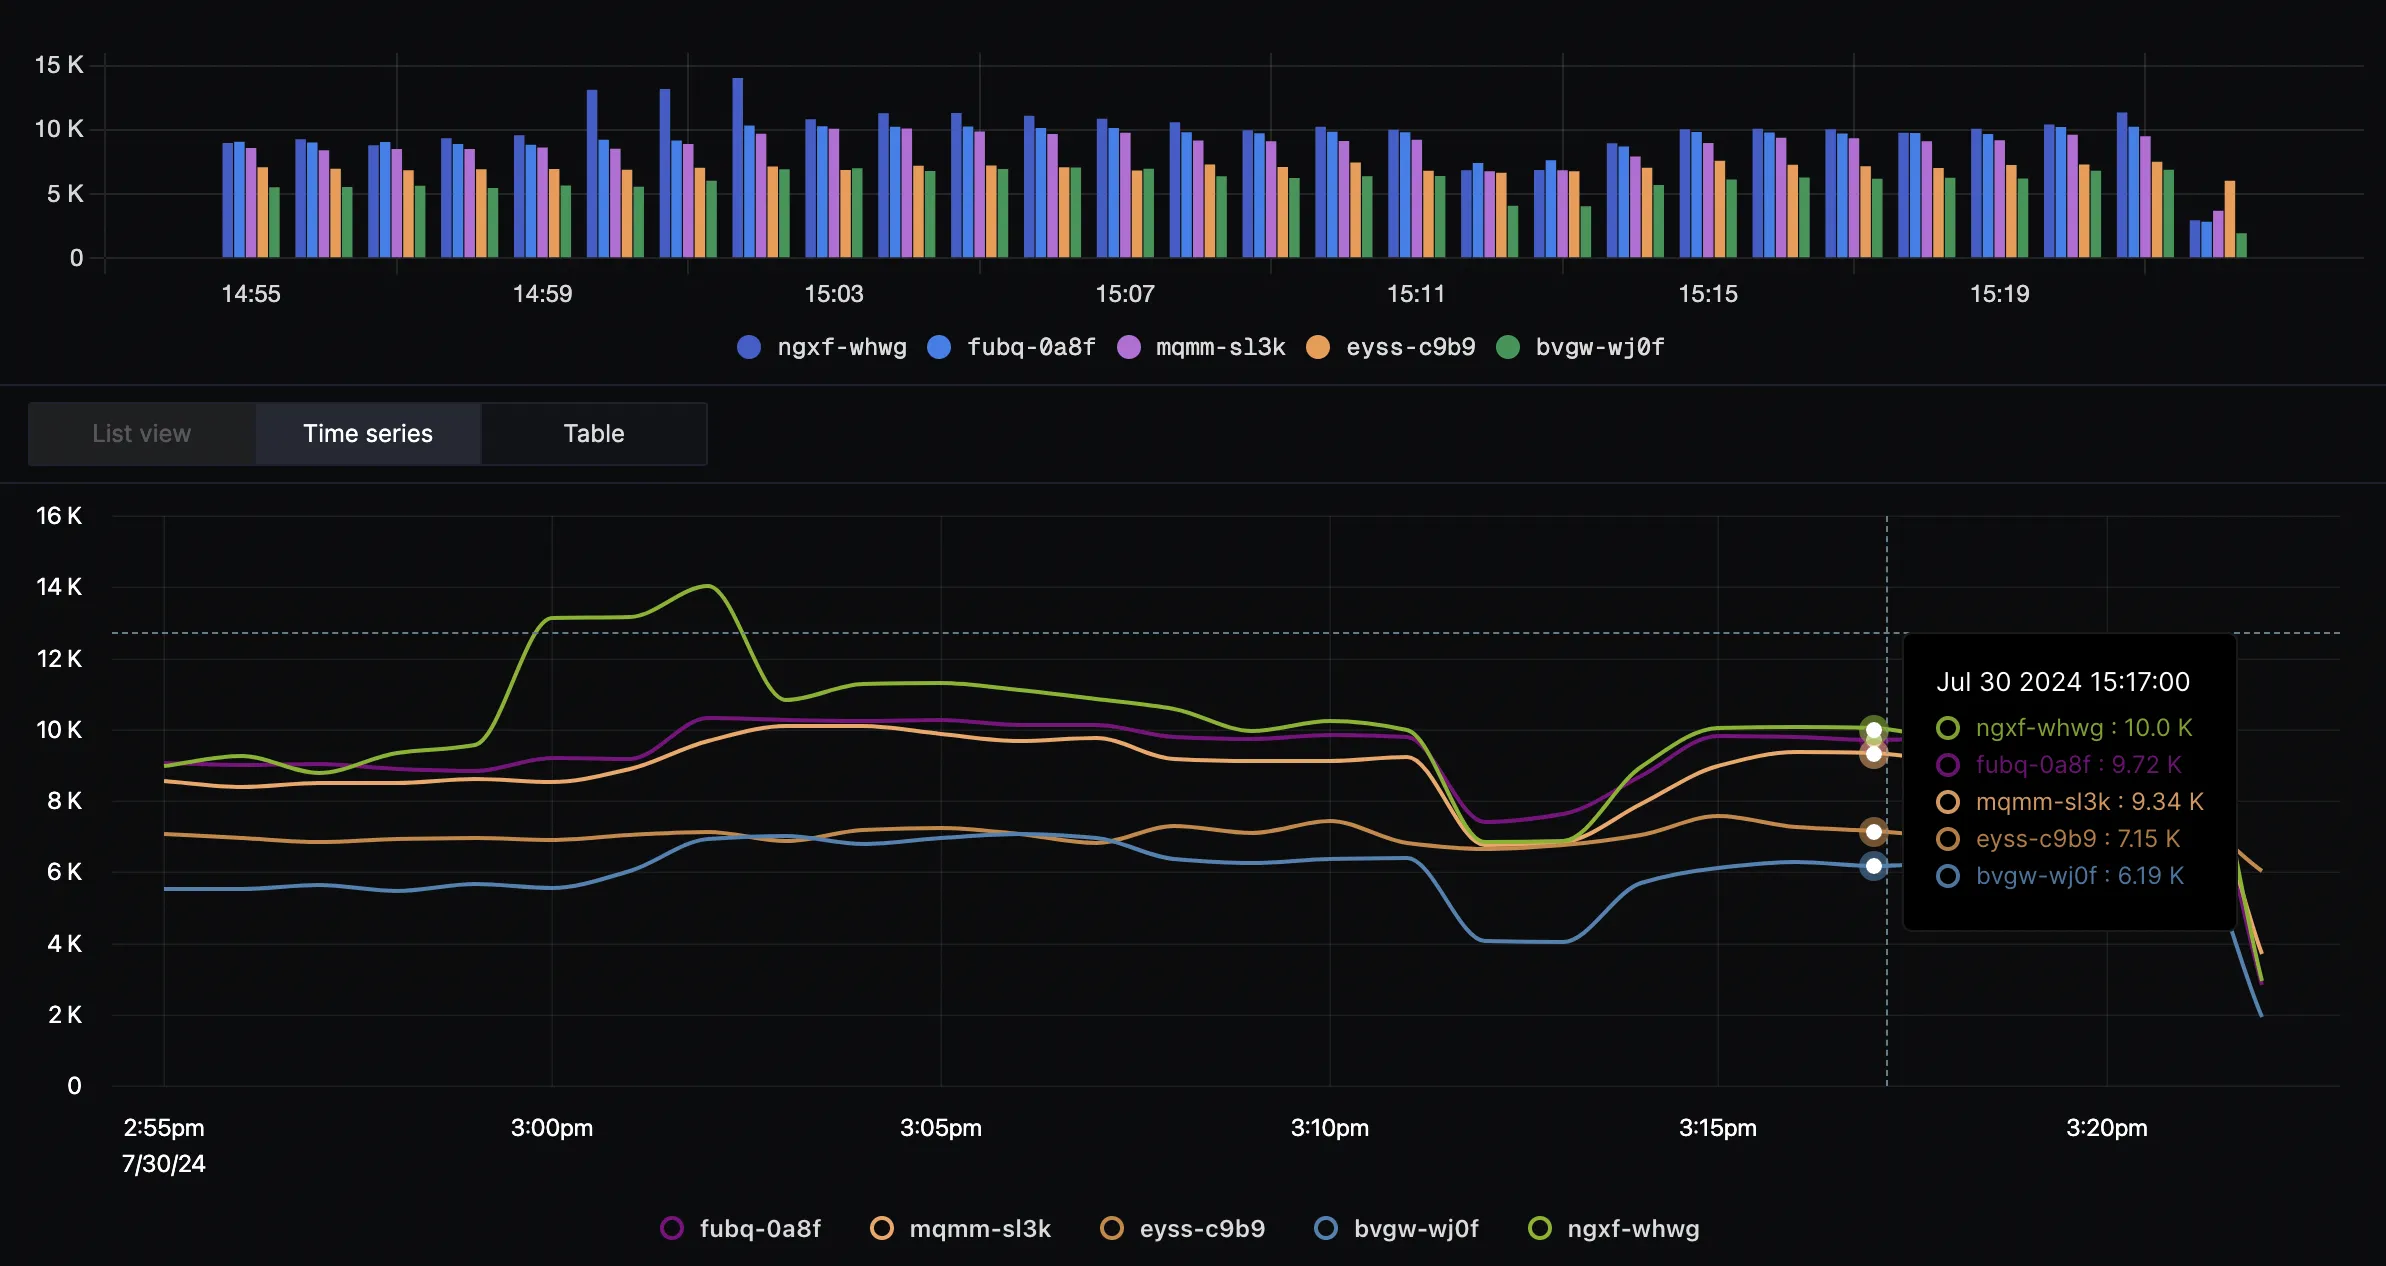
Our logs explorer comes packed with different visualizations to simplify troubleshooting and finding patterns.
Logs in Detail
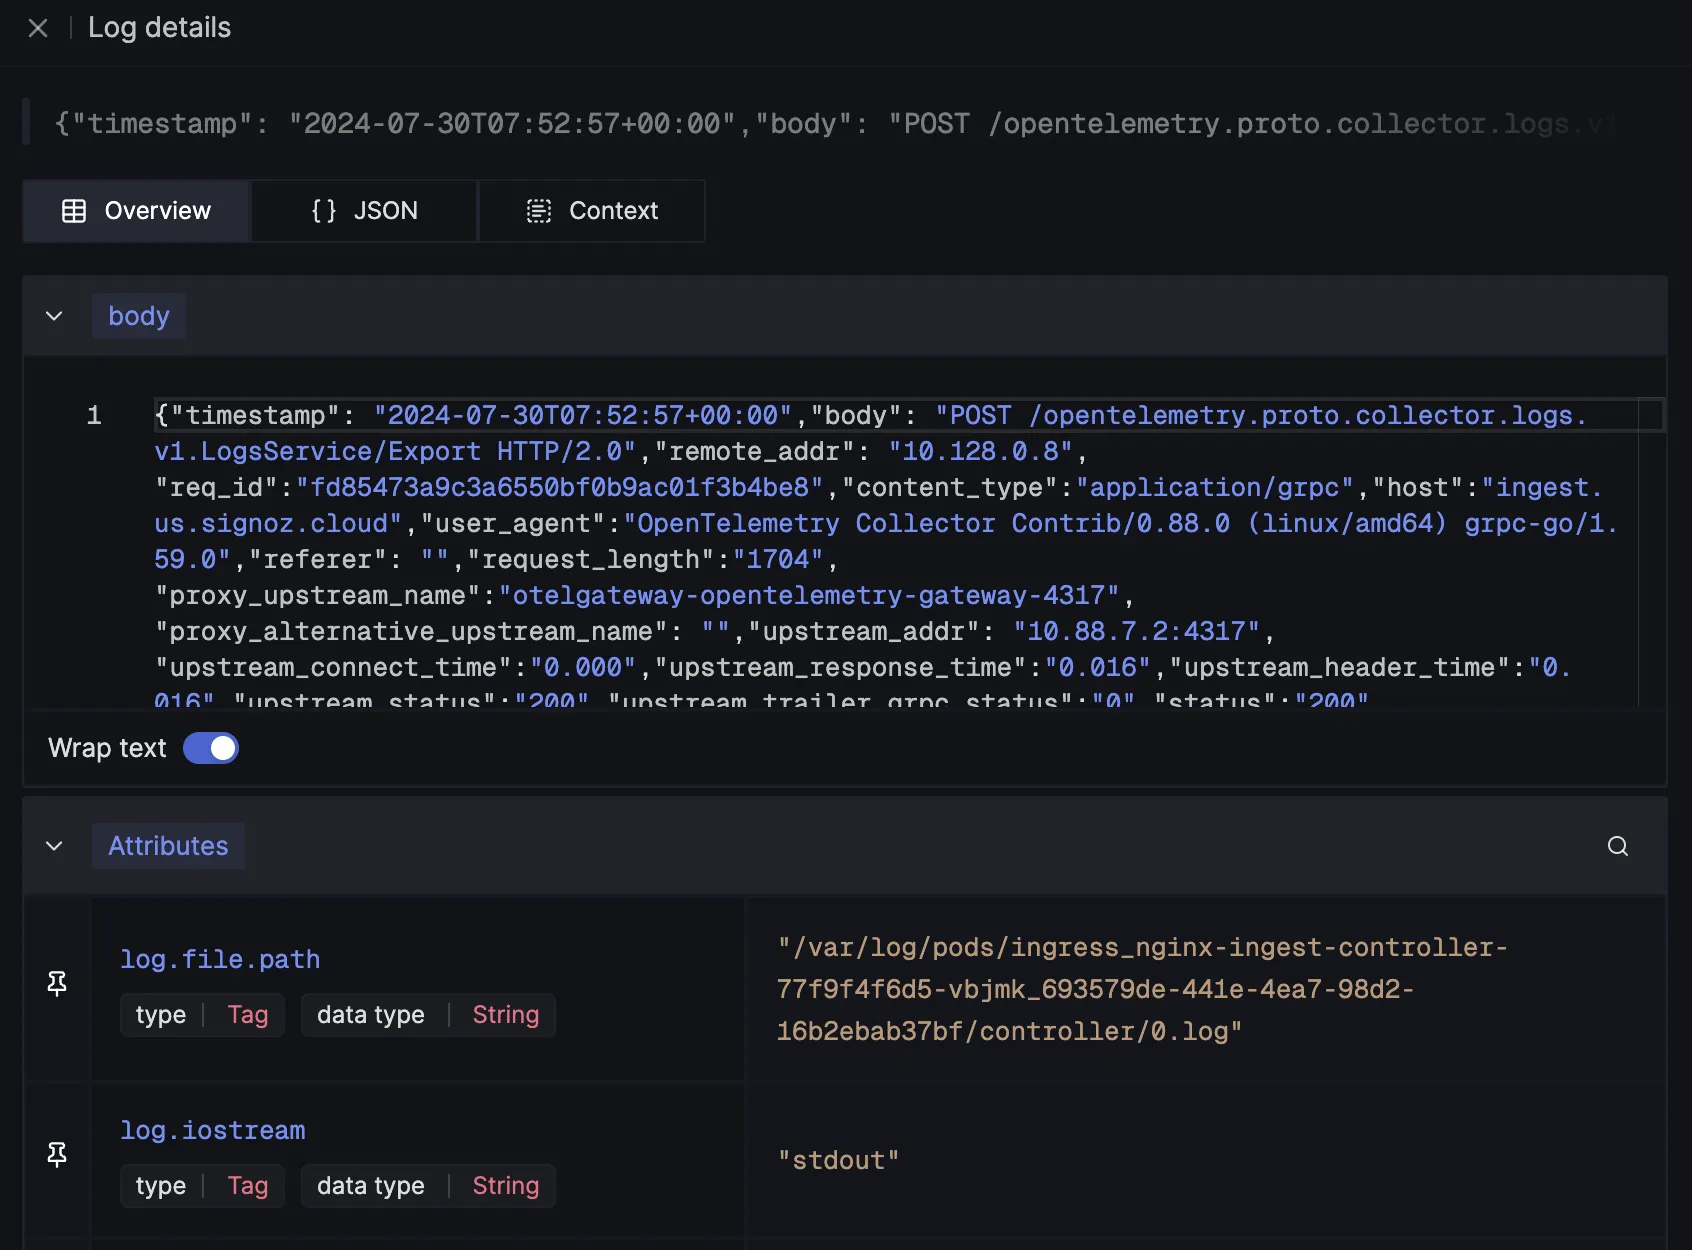
Get a comprehensive view of your logs with a detailed view of logs. See overview, search for attributes, filters based on JSON data, and more to let you explore your logs in detail.
Logs in Context
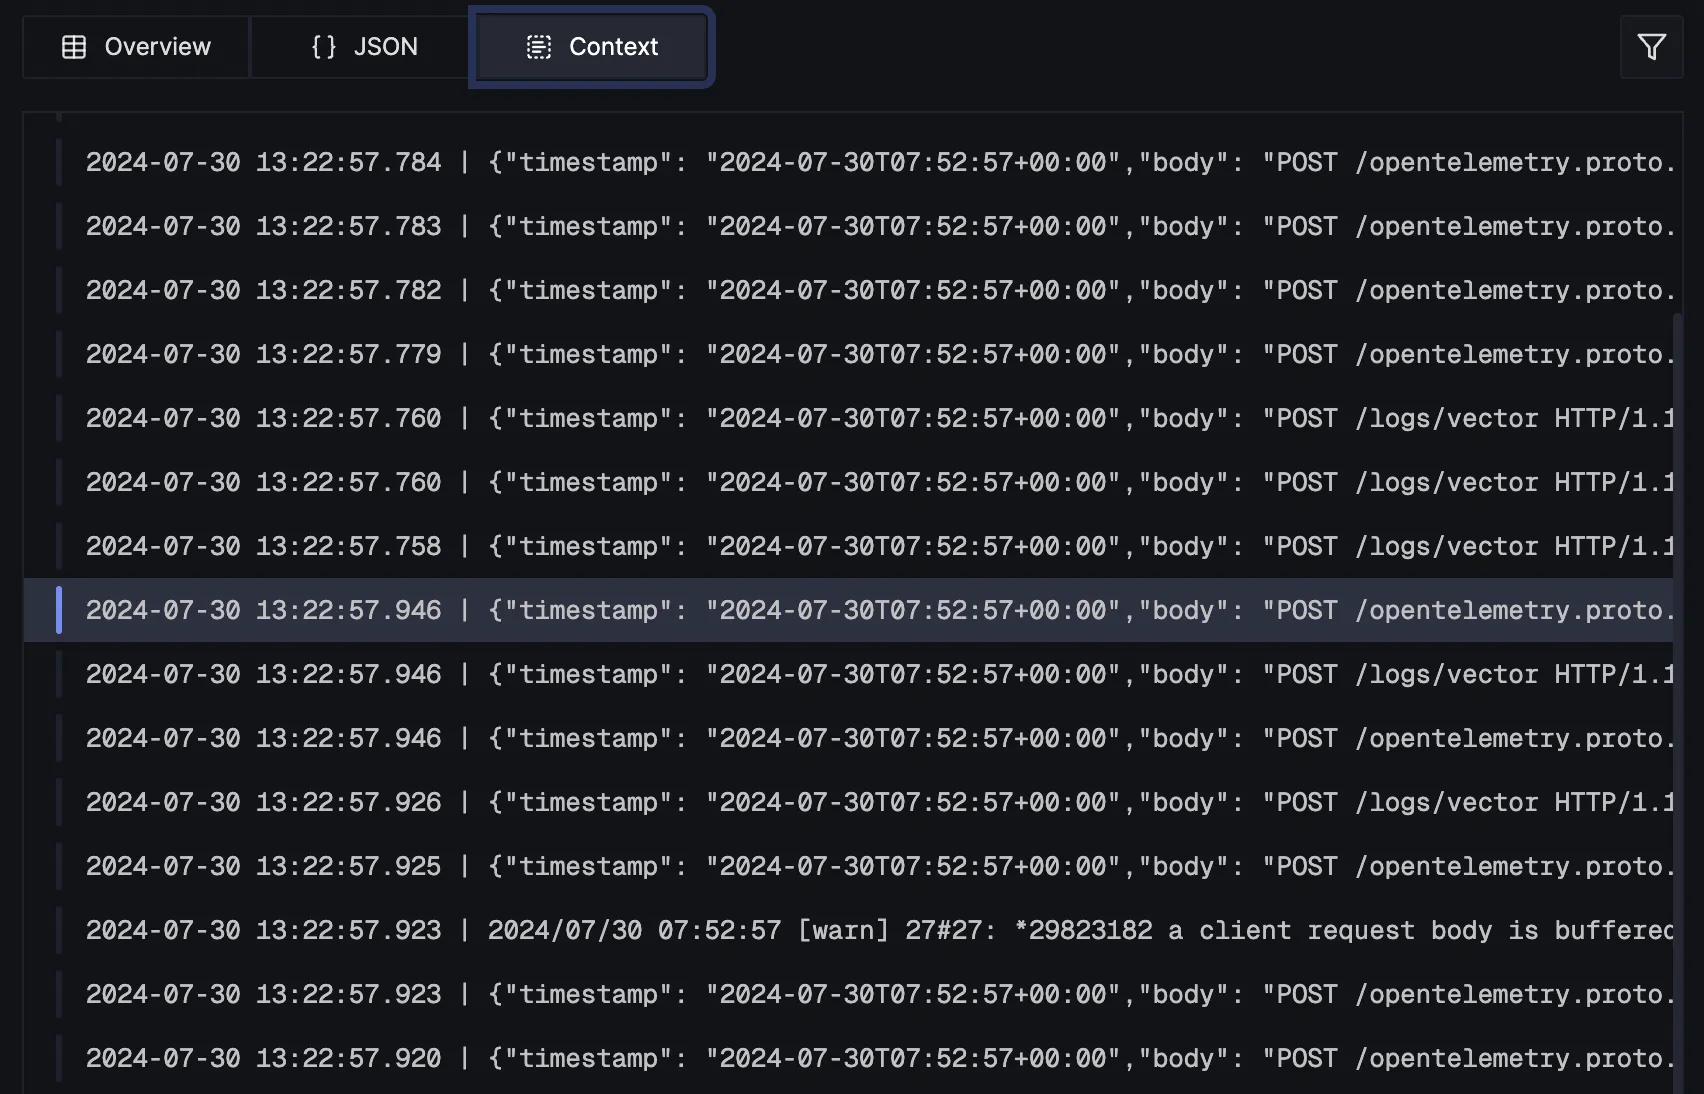
Get more context around a log entry with Context view. For example, for a particular service view logs of the specific host, while that service might be running on multiple hosts.
Saved Views
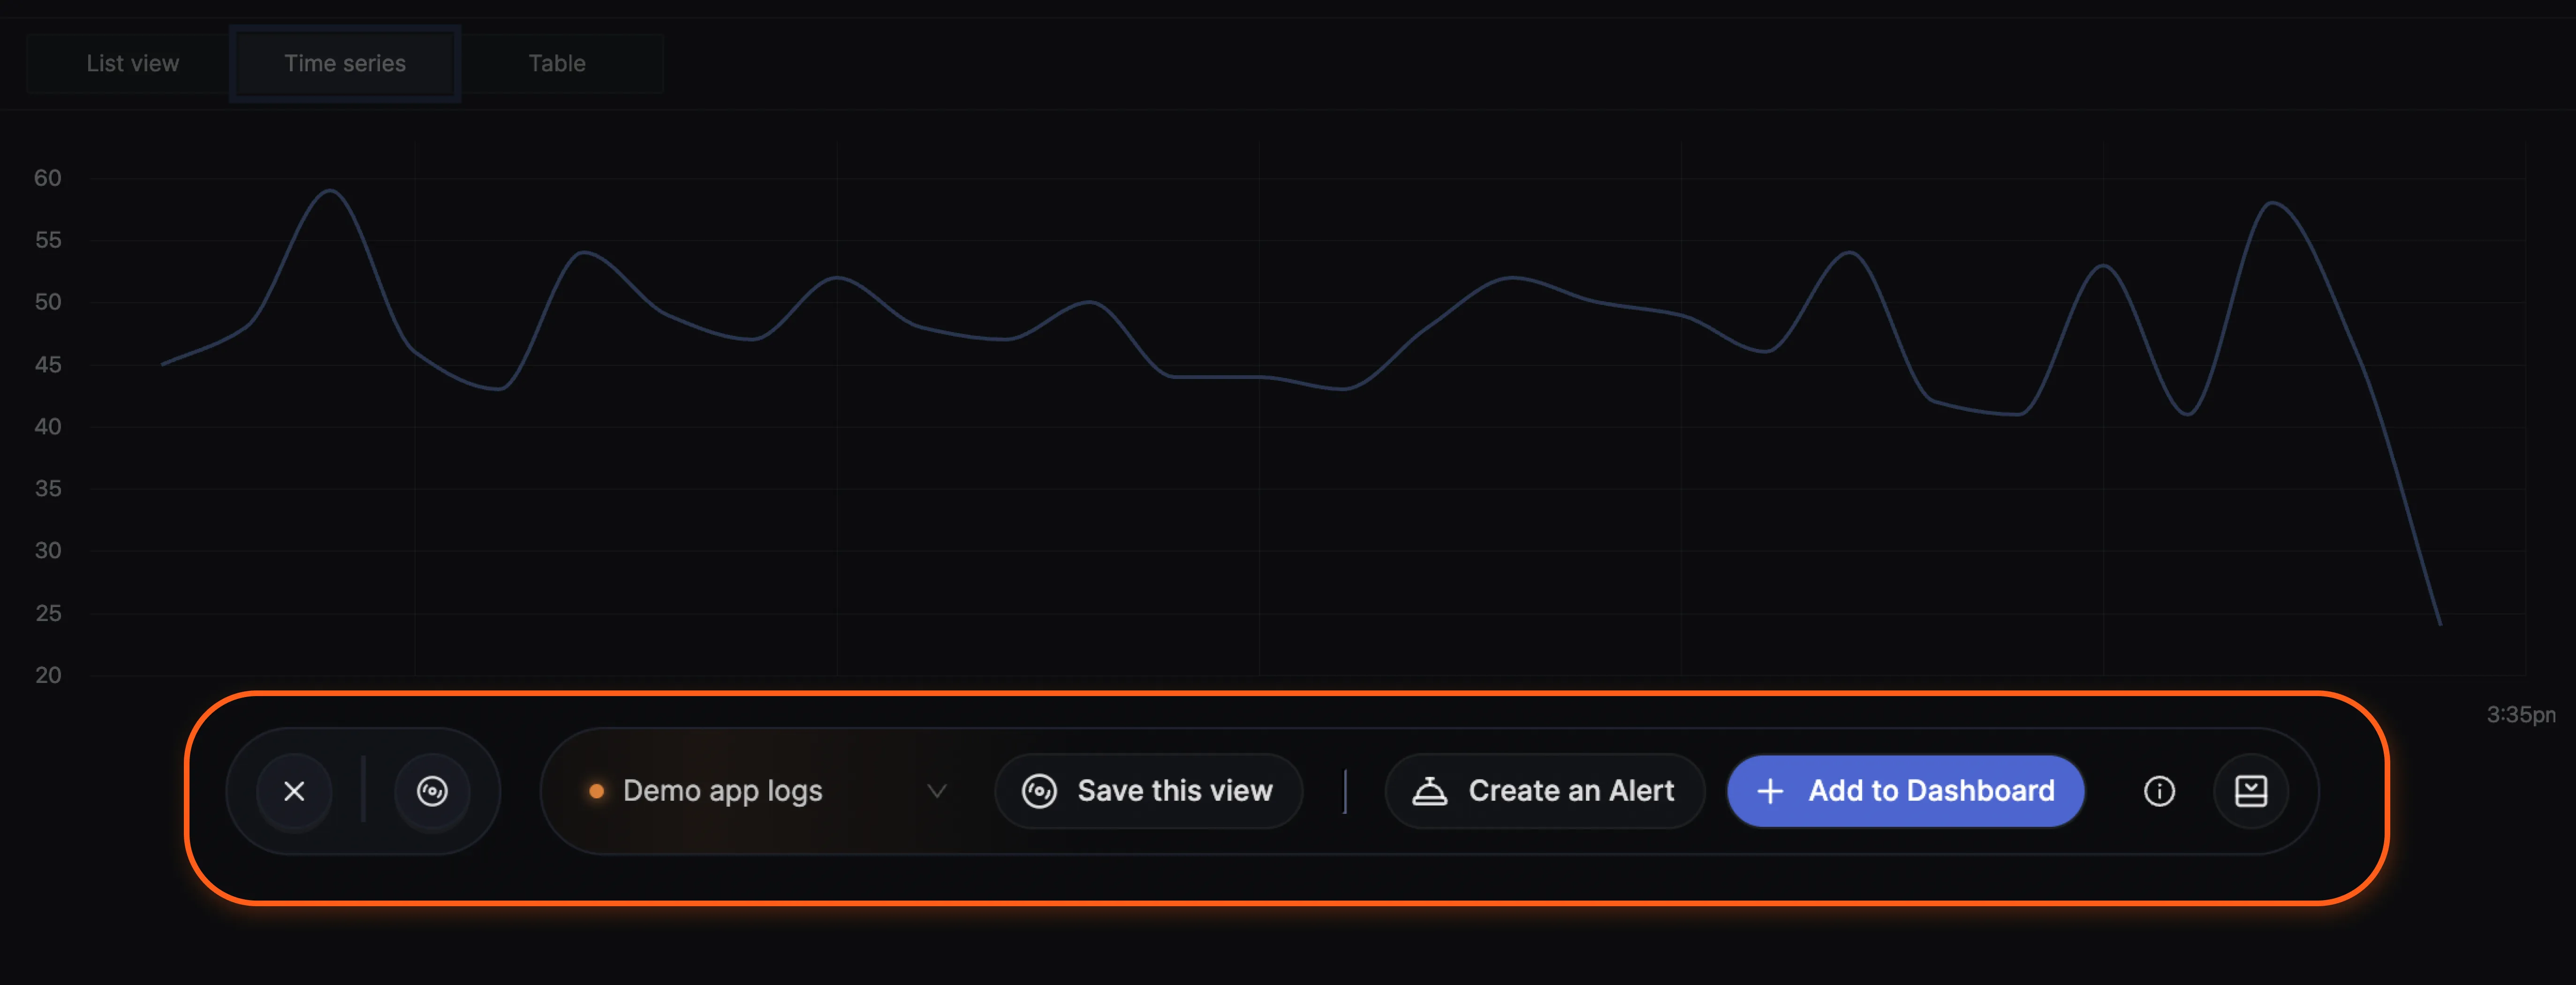
Save views that matter - Apply complex queries and save that view for future reference. Your teammates can also access them if they need to.
JSON Search
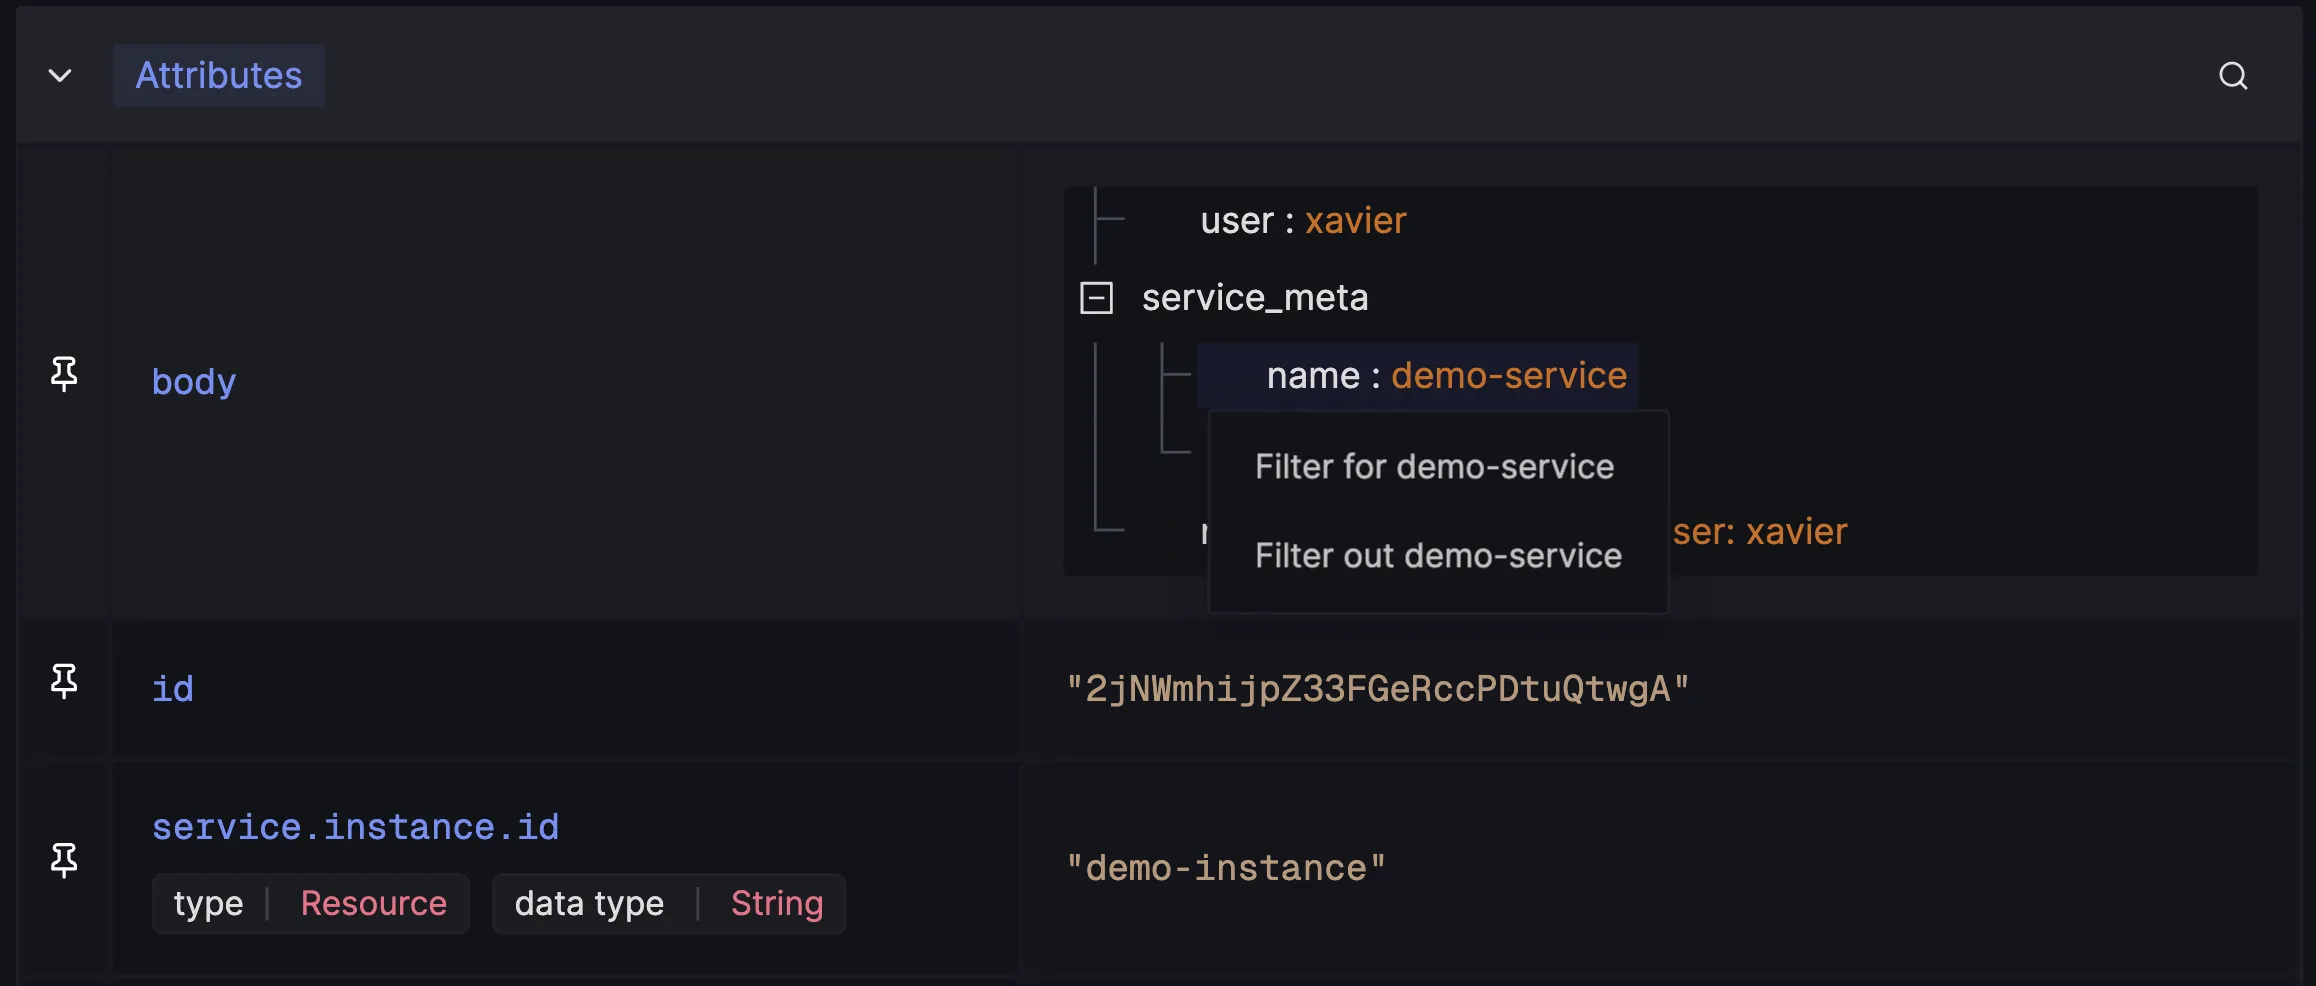
Quickly apply filters on JSON data present inside the logs body.
Live Logs
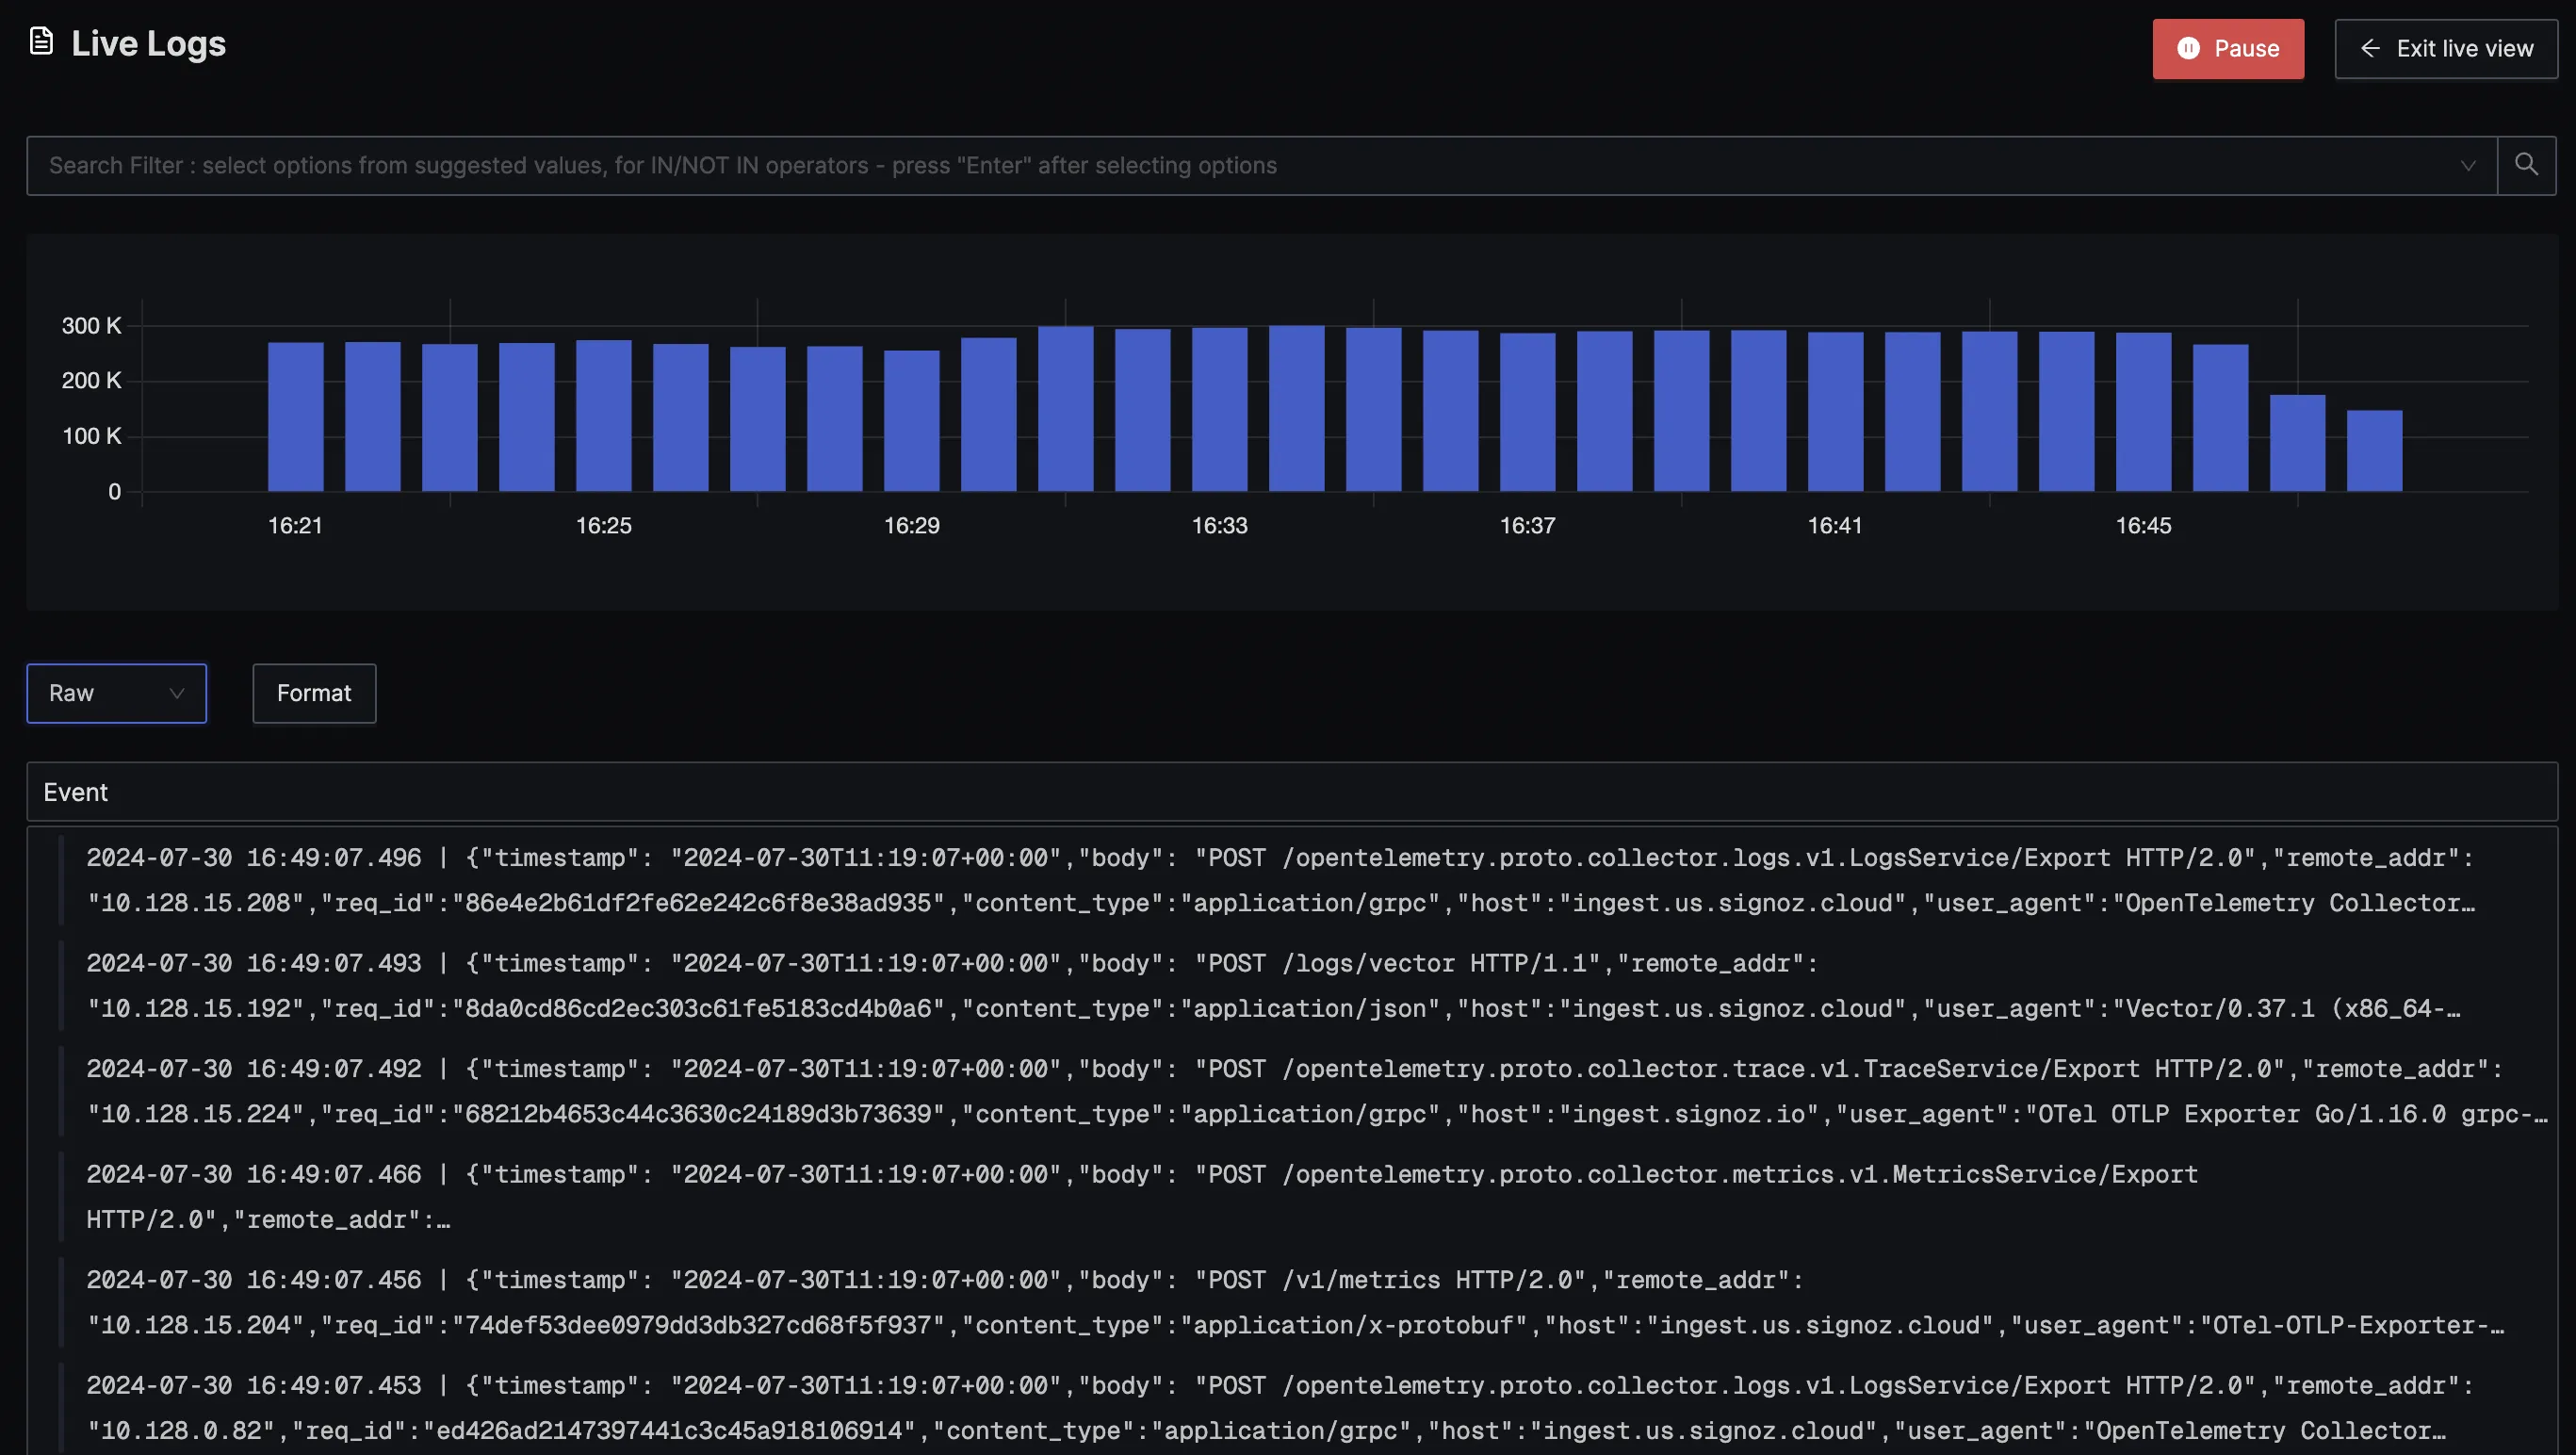
View logs in real-time with Live Logs.
Correlation with other signals

Correlate your logs with traces and vice-versa to get a much richer context while debugging. Using OpenTelemetry for application observability can unlock the true potential of your telemetry data.
Add to dashboards & Create Alerts
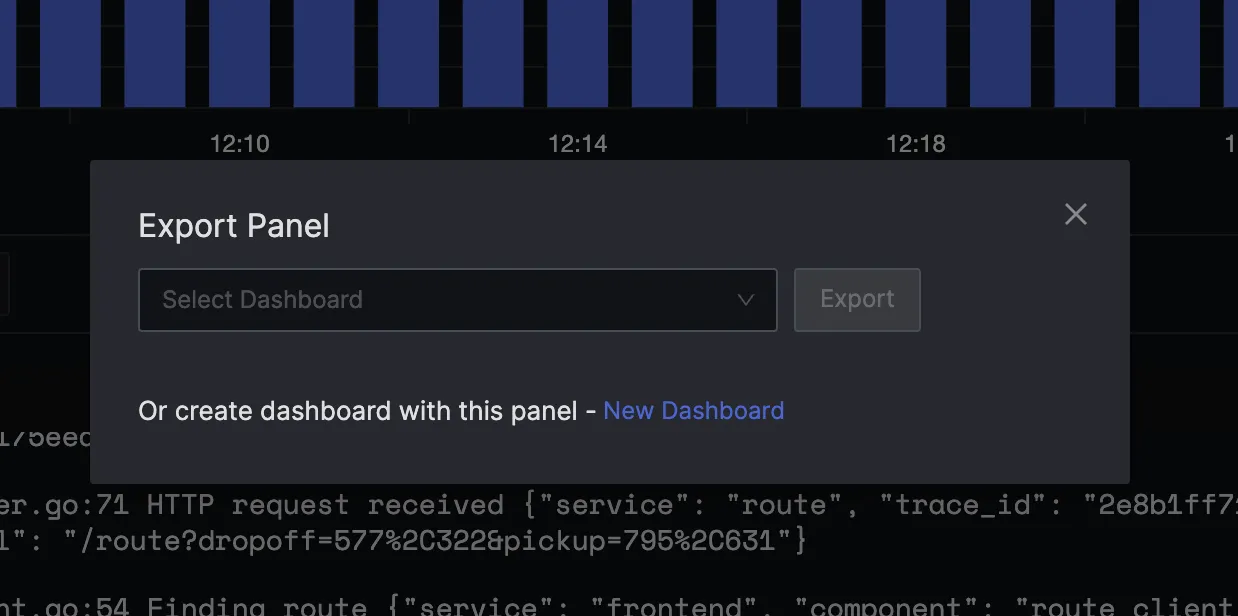
Anything that you query can be added to dashboards for continued monitoring and visualization.
Use SigNoz
Logs for...
Use correlated logs and traces to debug applications.
Use traces to identify performance bottlenecks and then debug it with logs associated with that trace.
Create alerts from logs.
For example, create alerts on error logs in the last 5 minutes based on a threshold.
Create dashboards to view all the error logs from different services.
Query logs for specific conditions and add them to dashboards for continuous monitoring.
Share specific log lines with your teammates while troubleshooting
Improved collaboration with your teammates while debugging by sharing specific log lines.
Simple
usage-based
pricing
Tired of Datadog’s unpredictable bills or New Relic’s user-based pricing?
We’re here for you.
Pay only for data you send
We don’t have any SKU-based pricing. Get access to all features in the plan selected and only pay for the data you send. Pay only $0.3 per GB of ingested logs.
Add unlimited team members
Observability should be available to every developer at your company. After all, anyone can need debugging. That’s why we don’t charge for user seats, and you can add as many team members as you want.
No Host (container or node) based pricing
For modern cloud-based applications it doesn’t make sense to charge on the basis of number of hosts or containers. You don’t need to worry about auto-scaling during peak hours. Only pay for the amount of data sent no matter the number of hosts.
Developers
Love
SigNoz

10 million+
OSS Downloads

18k+
GitHub Stars

140+
Contributors

4.5k+
Community Members
Get started with
SigNoz Cloud today
