OpenTelemetry can be used to generate telemetry data from your Go applications. The collected data can then be sent to an observability tool for storage and visualization. OpenTelemetry is an open-source project under the Cloud Native Computing Foundation (CNCF) that aims to standardize the generation and collection of telemetry data.

In this tutorial, we will use OpenTelemetry Go libraries to instrument a Go application and then visualize it using an open-source observability tool - SigNoz.
Steps to get started with OpenTelemetry for Go applications:
- Installing SigNoz
- Instrumenting a Go application with OpenTelemetry
- Adding custom attributes and custom events to spans
- Monitoring your Go application with SigNoz dashboards
Installing SigNoz
First, you need to install SigNoz so that OpenTelemetry can send the data to it.
SigNoz can be installed on macOS or Linux machines in just three steps by using a simple install script.
The install script automatically installs Docker Engine on Linux. However, on macOS, you must manually install Docker Engine before running the install script.
git clone -b main https://github.com/SigNoz/signoz.git
cd signoz/deploy/
./install.sh
You can visit our documentation for instructions on how to install SigNoz using Docker Swarm and Helm Charts.
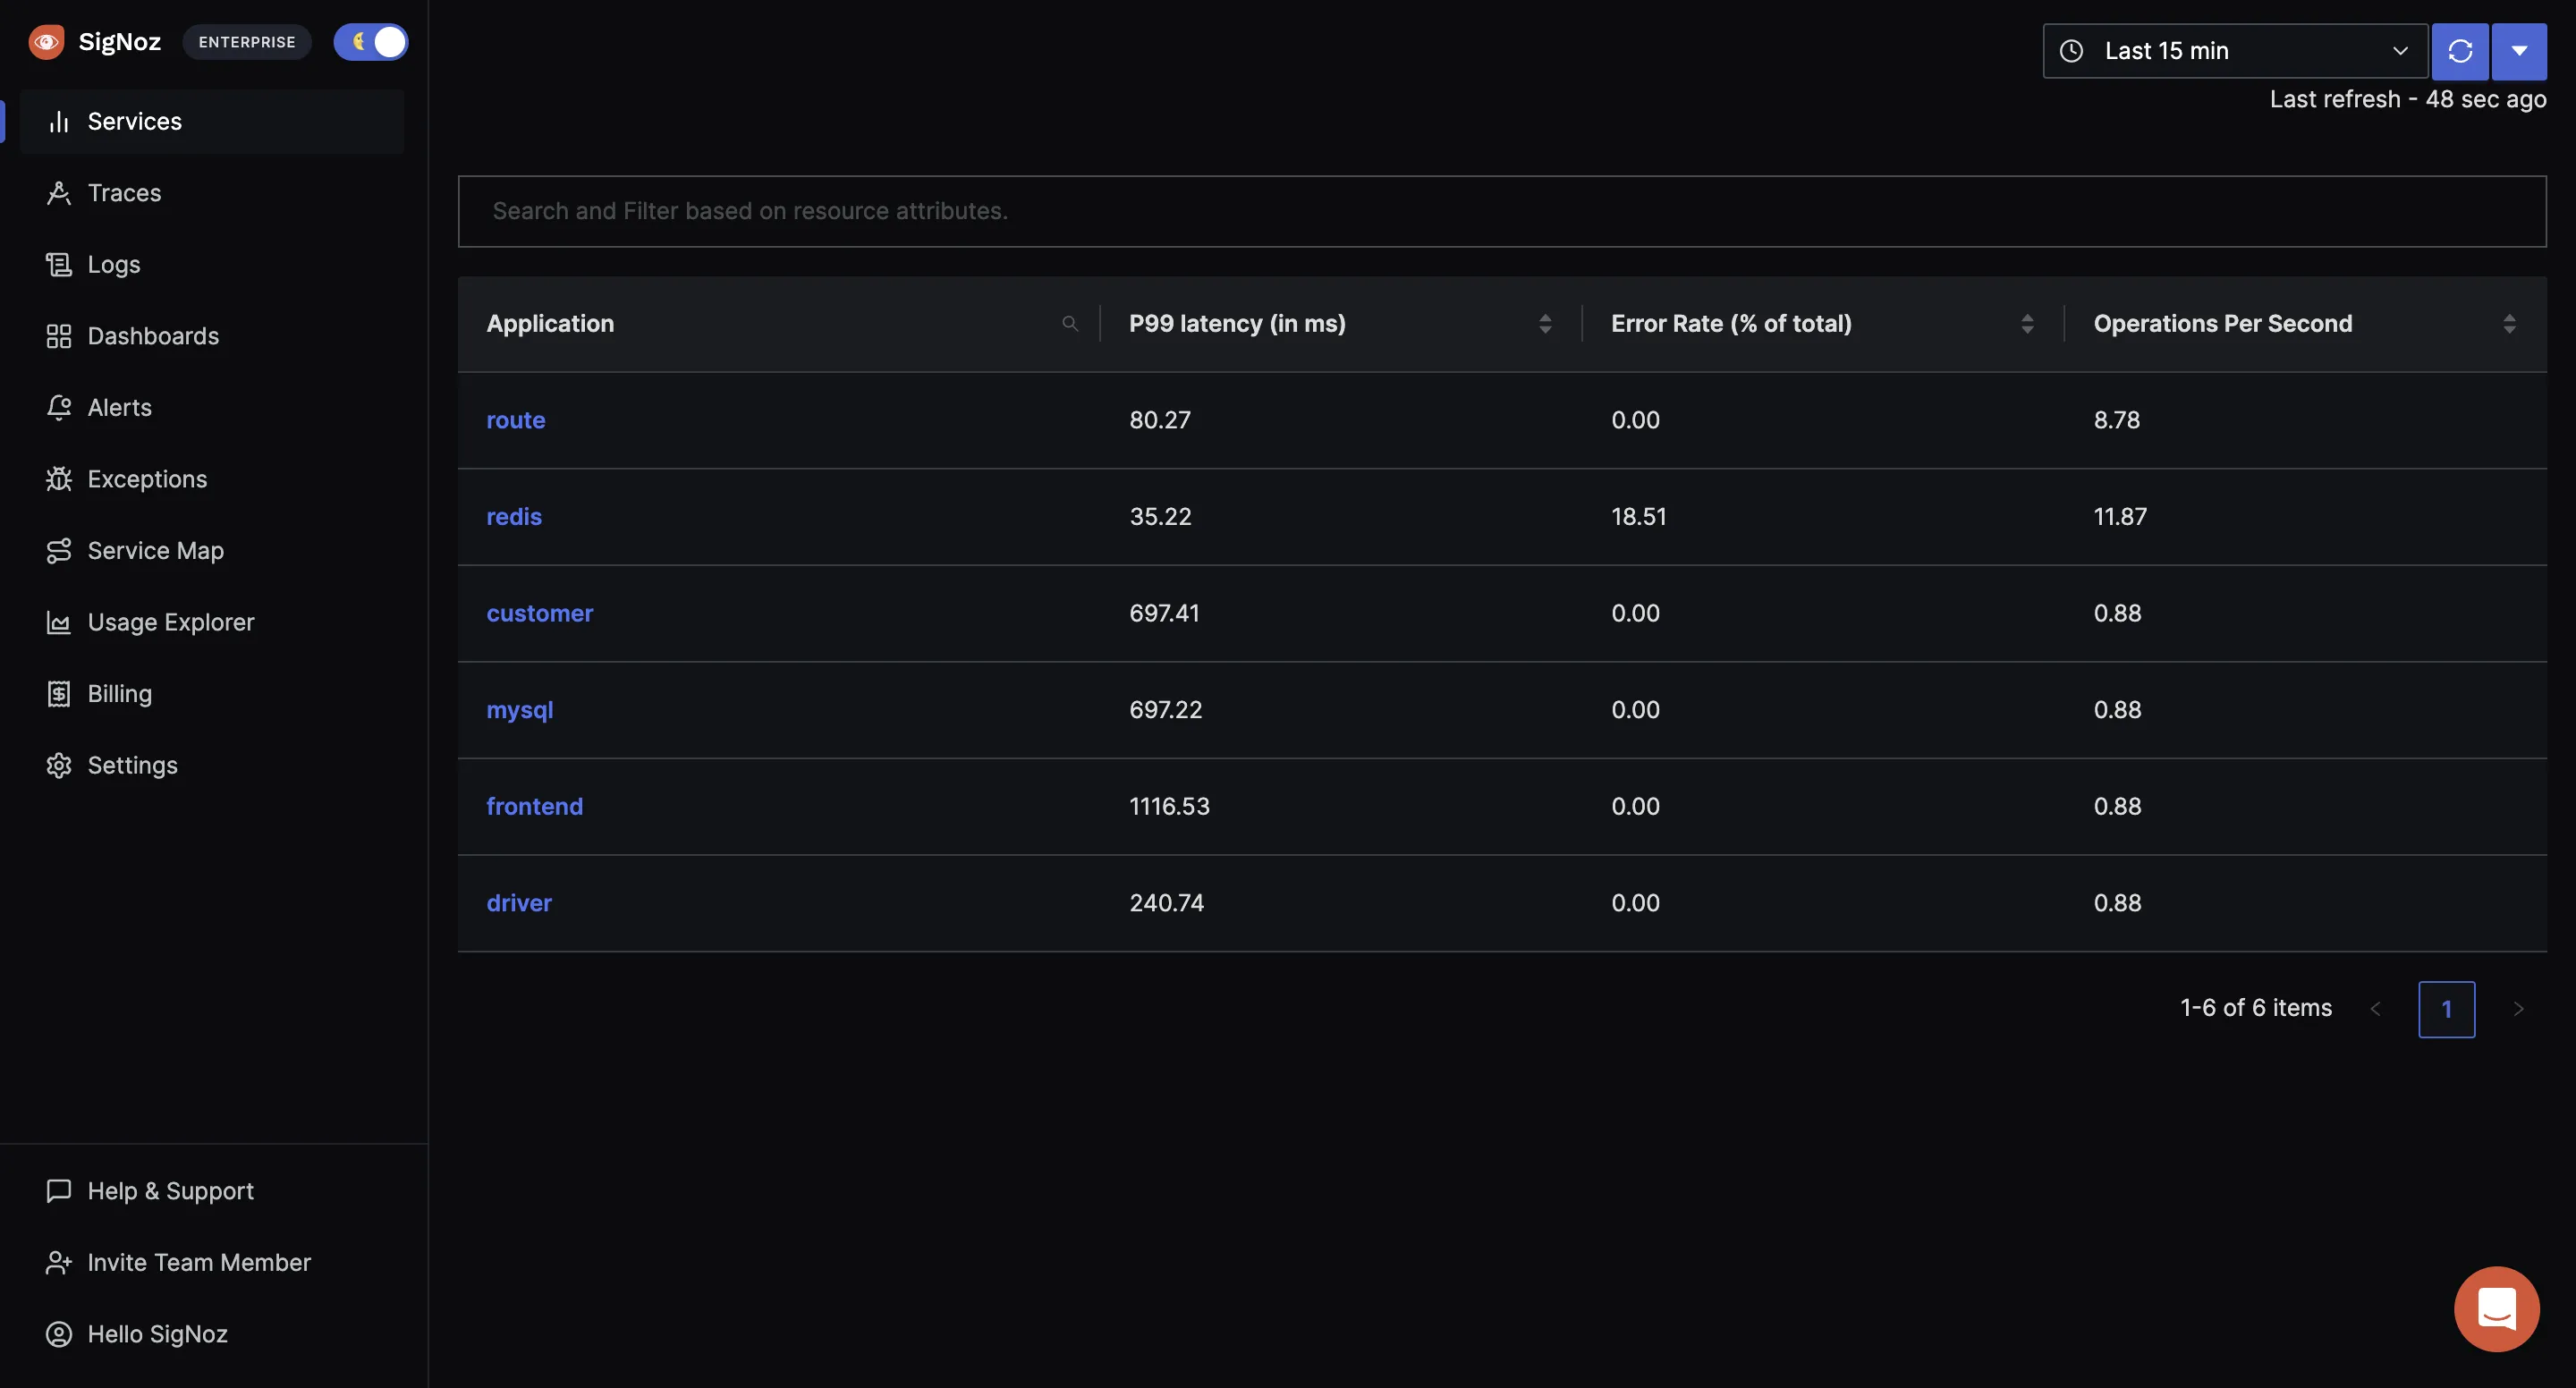
When you are done installing SigNoz, you can access the UI at http://localhost:3301
Instrumenting a Go application with OpenTelemetry
Step 1: Get sample Go app from GitHub
Prerequisites: You will SQLite to run the sample application.
The sample Go app repo contains the boilerplate code that we will instrument.
If you want to follow along with the tutorial, then you should follow the without-instrumentation branch.
Step 2: Install dependencies
Dependencies related to OpenTelemetry exporter and SDK have to be installed first. Run the below commands after navigating to the application source folder:
go get go.opentelemetry.io/otel \
  go.opentelemetry.io/otel/trace \
  go.opentelemetry.io/otel/sdk \
  go.opentelemetry.io/contrib/instrumentation/github.com/gin-gonic/gin/otelgin \
  go.opentelemetry.io/otel/exporters/otlp/otlptrace \
  go.opentelemetry.io/otel/exporters/otlp/otlptrace/otlptracegrpc
Step 3: Declare environment variables for configuring OpenTelemetry
Declare the following global variables in main.go which we will use to configure OpenTelemetry:
var (
	serviceName  = os.Getenv("SERVICE_NAME")
	collectorURL = os.Getenv("OTEL_EXPORTER_OTLP_ENDPOINT")
	insecure     = os.Getenv("INSECURE_MODE")
)
Step 4: Instrument your Go application with OpenTelemetry
To configure your application to send data we will need a function to initialize OpenTelemetry. Add the following snippet of code in your main.go file.
import (
  	.....

	"github.com/gin-gonic/gin"
	"go.opentelemetry.io/otel"
	"go.opentelemetry.io/otel/attribute"
	"go.opentelemetry.io/otel/exporters/otlp/otlptrace"
	"go.opentelemetry.io/otel/exporters/otlp/otlptrace/otlptracegrpc"

	"go.opentelemetry.io/otel/sdk/resource"
	sdktrace "go.opentelemetry.io/otel/sdk/trace"
)

func initTracer() func(context.Context) error {


	secureOption := otlptracegrpc.WithTLSCredentials(credentials.NewClientTLSFromCert(nil, ""))
	if len(insecure) > 0 {
		secureOption = otlptracegrpc.WithInsecure()
	}

	exporter, err := otlptrace.New(
		context.Background(),
		otlptracegrpc.NewClient(
			secureOption,
			otlptracegrpc.WithEndpoint(collectorURL),
		),
	)

	if err != nil {
		log.Fatal(err)
	}
	resources, err := resource.New(
		context.Background(),
		resource.WithAttributes(
			attribute.String("service.name", serviceName),
			attribute.String("library.language", "go"),
		),
	)
	if err != nil {
		log.Printf("Could not set resources: ", err)
	}

	otel.SetTracerProvider(
		sdktrace.NewTracerProvider(
			sdktrace.WithSampler(sdktrace.AlwaysSample()),
			sdktrace.WithBatcher(exporter),
			sdktrace.WithResource(resources),
		),
	)
	return exporter.Shutdown
}
Step 5: Initialize the tracer in main.go
Modify the main function to initialise the tracer in main.go. Initiate the tracer at the very beginning of our main function.
func main() {
	cleanup := initTracer()
	defer cleanup(context.Background())

	......
}
Step 6: Add the OpenTelemetry Gin middleware
Configure Gin to use the middleware by adding the following lines in main.go.
import (
	....
  "go.opentelemetry.io/contrib/instrumentation/github.com/gin-gonic/gin/otelgin"
)

func main() {
	......
	r := gin.Default()
	r.Use(otelgin.Middleware(serviceName))
	......
}
Step 7: Set environment variables and run your Go Gin application
Now that you have instrumented your Go Gin application with OpenTelemetry, you need to set some environment variables to send data to SigNoz backend and run your application.
SERVICE_NAME=goApp INSECURE_MODE=true OTEL_EXPORTER_OTLP_ENDPOINT=<IP of SigNoz backend>:4317 go run main.go
IP os SigNoz backend should be without http/https scheme.
SERVICE_NAME: goGinApp (you can name it whatever you want)
OTEL_EXPORTER_OTLP_ENDPOINT: localhost:4317
Since, we have installed SigNoz on our local machine, we use the above IP. If you install SigNoz on a different machine, you can update it with the relevant IP.
Hence, the final run command looks like this:
SERVICE_NAME=goGinApp INSECURE_MODE=true OTEL_EXPORTER_OTLP_ENDPOINT=localhost:4317 go run main.go
And, congratulations! You have instrumented your sample Golang app.
Hit the /books endpoint of the bookstore app at http://localhost:8090/books. Refresh it a bunch of times in order to generate load, and wait for 1-2 mins for data to appear on SigNoz dashboard.
Adding custom attributes and custom events to spans
It’s also possible to set custom attributes or tags to a span. To add custom attributes and events follow the below steps:
Step 1: Import trace and attribute libraries
import (
	...
	"go.opentelemetry.io/otel/attribute"
	"go.opentelemetry.io/otel/trace"
)
Step 2: Fetch current span from context
span := trace.SpanFromContext(c.Request.Context())
Step 3: Set attribute on current
span.SetAttributes(attribute.String("controller", "books"))
SigNoz dashboards can be used to track these custom attributes.
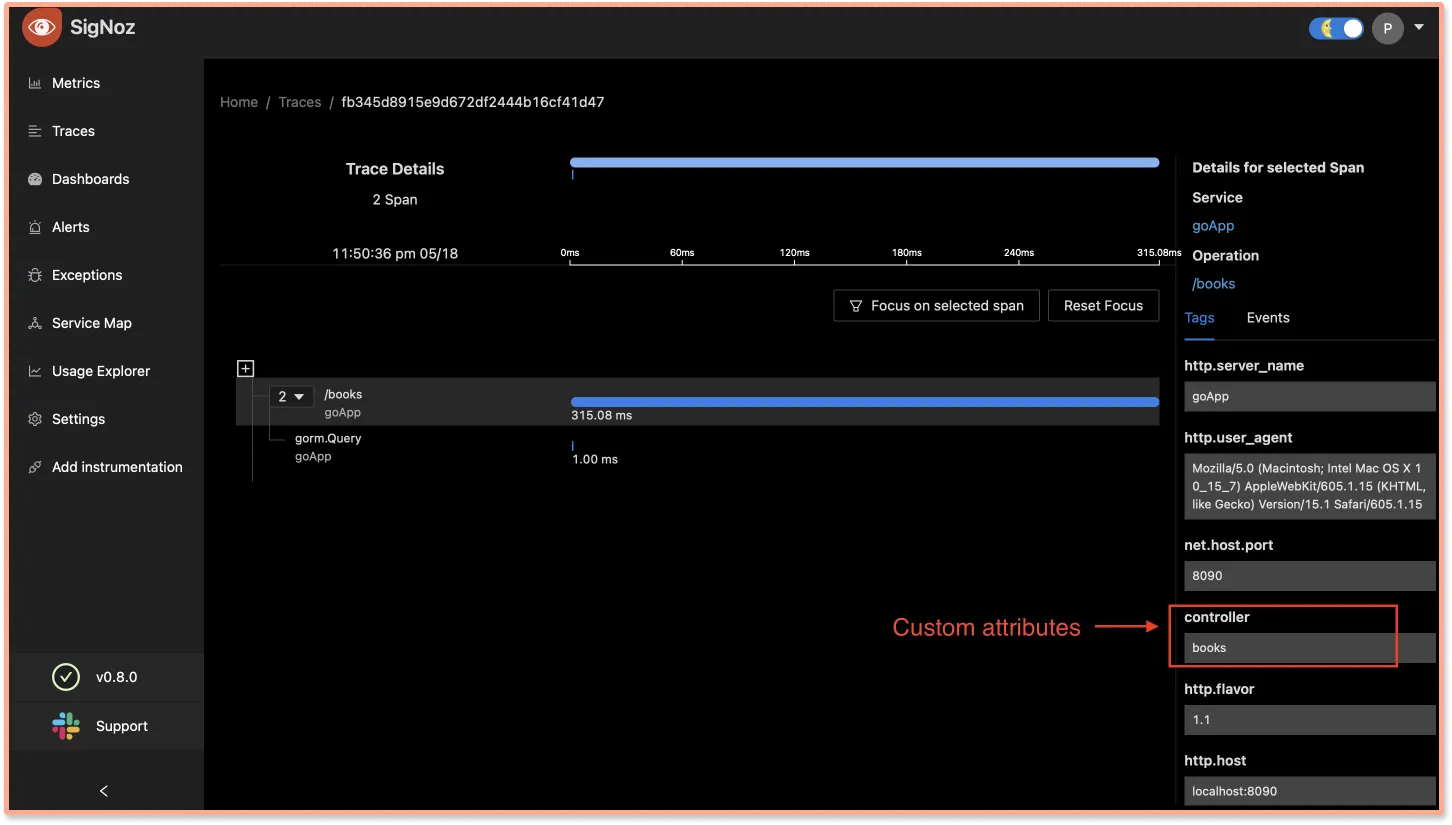
Tags section on SigNoz trace detail pageWe can also set custom event on the span with it’s own attribute.
span.AddEvent("This is a sample event", trace.WithAttributes(attribute.Int("pid", 4328), attribute.String("sampleAttribute", "Test")))
You can also see these custom events on SigNoz dashboard.
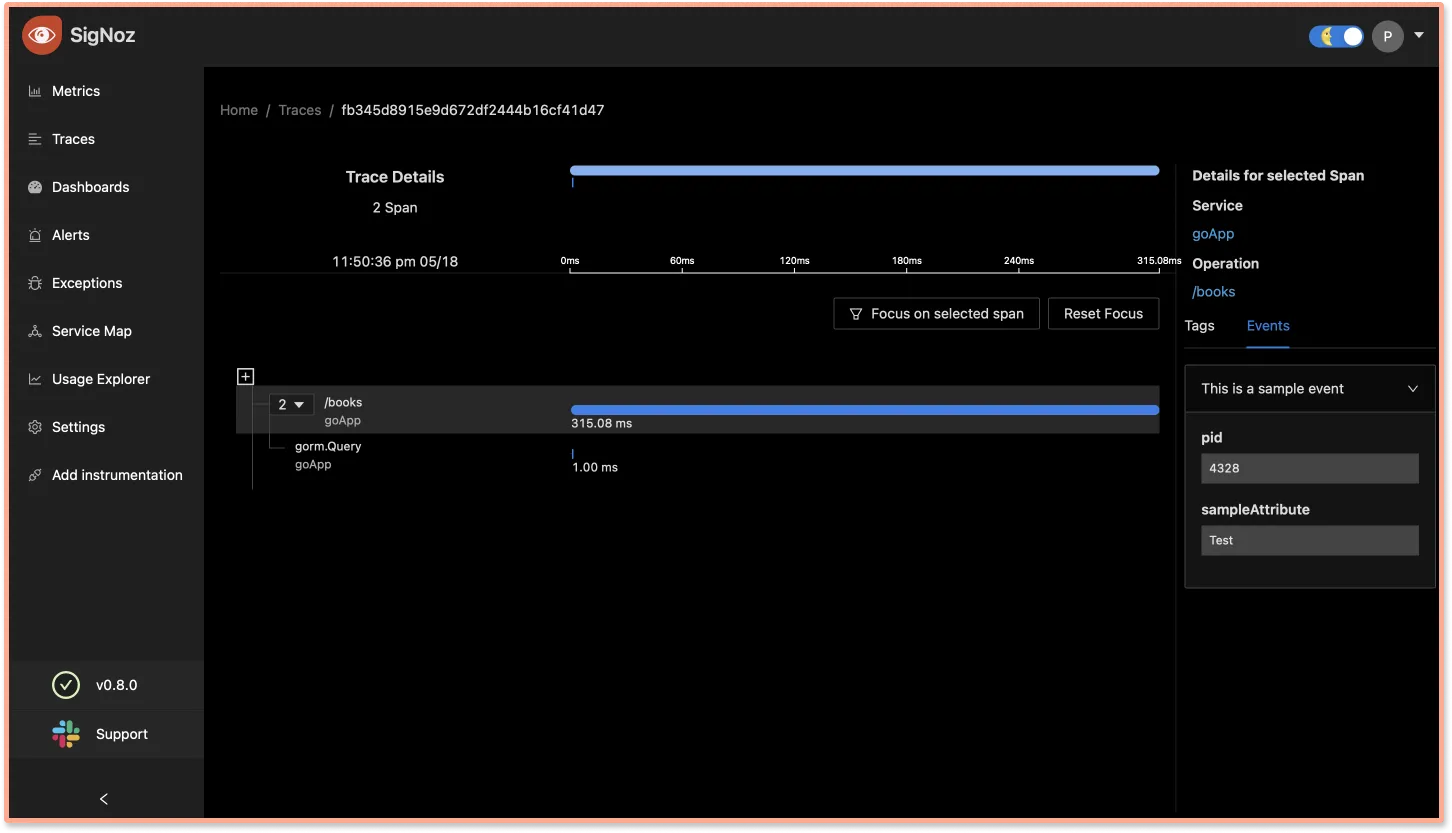
Events section on SigNoz trace detail pageEvents can be seen under Events section on SigNoz trace detail page
Monitor your Go application with SigNoz dashboards
With the above steps, you have instrumented your Go application with OpenTelemetry. OpenTelemetry sends the collected data to SigNoz which can be used to store it and visualize it. Let’s see how SigNoz can help you monitor your Go application.
You need to interact with your sample application a bit to generate some monitoring data. As mentioned earlier, hit the /books endpoint of the bookstore app at http://localhost:8090/books and refresh it a bunch of times in order to generate load.
You can then navigate to http://localhost:3301/application (needs signup) to see your Go app being monitored.
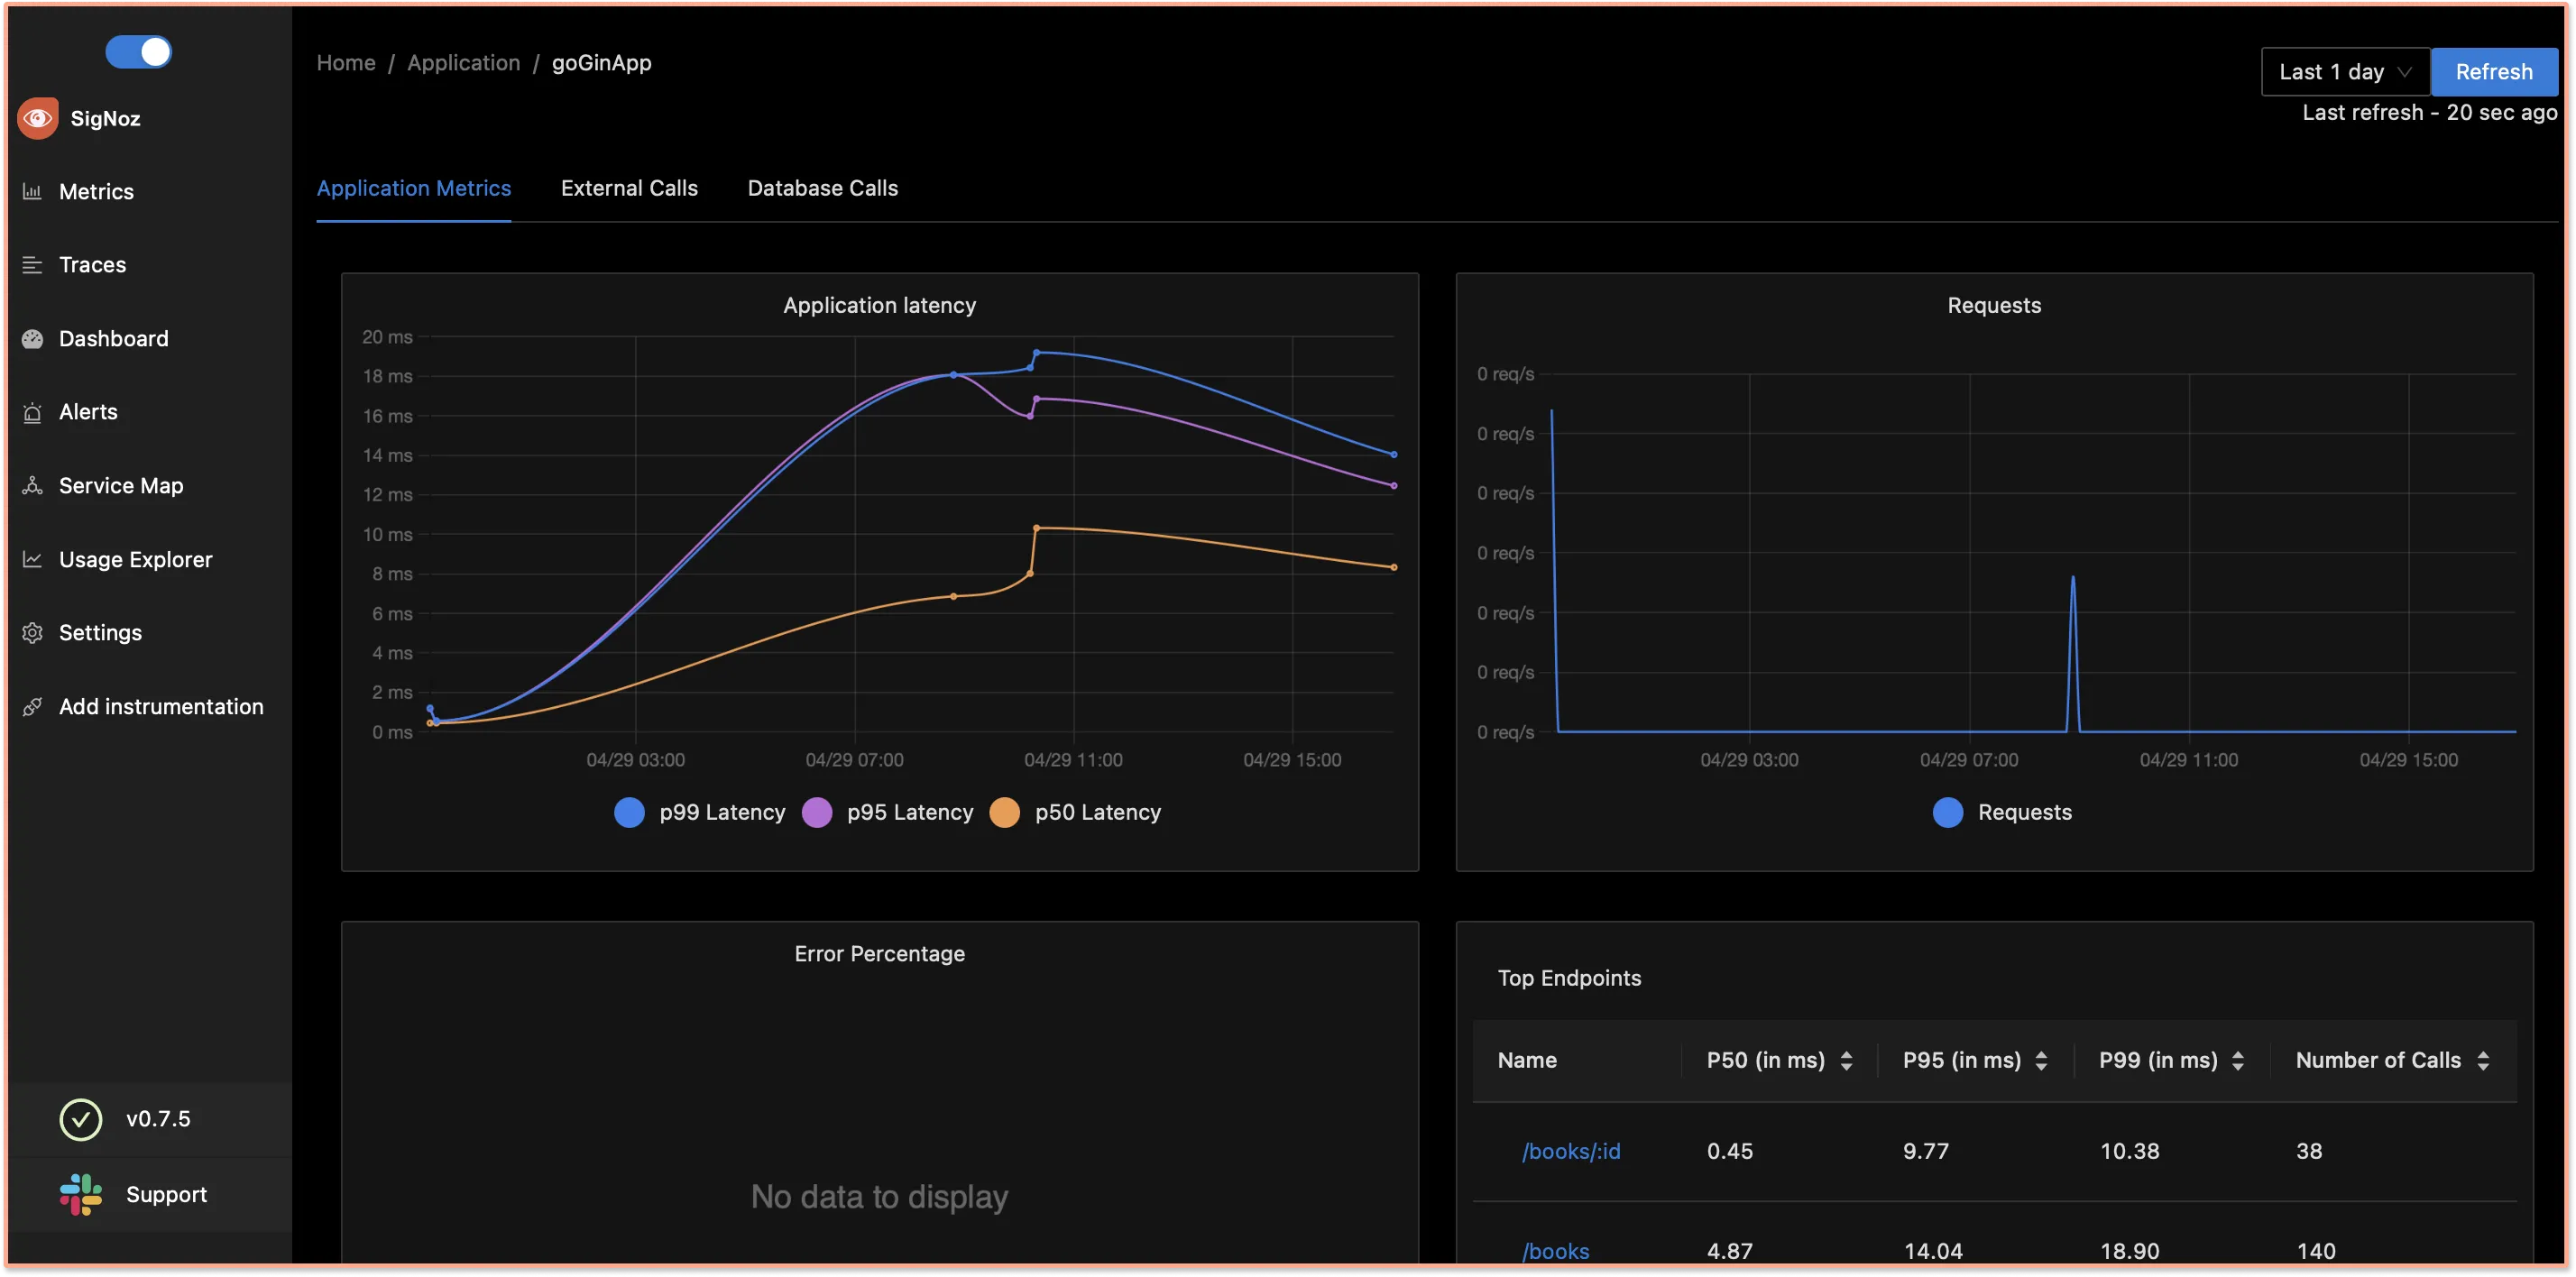
Go to Metrics→ goGinApp→ you will be able to see the dashboard.
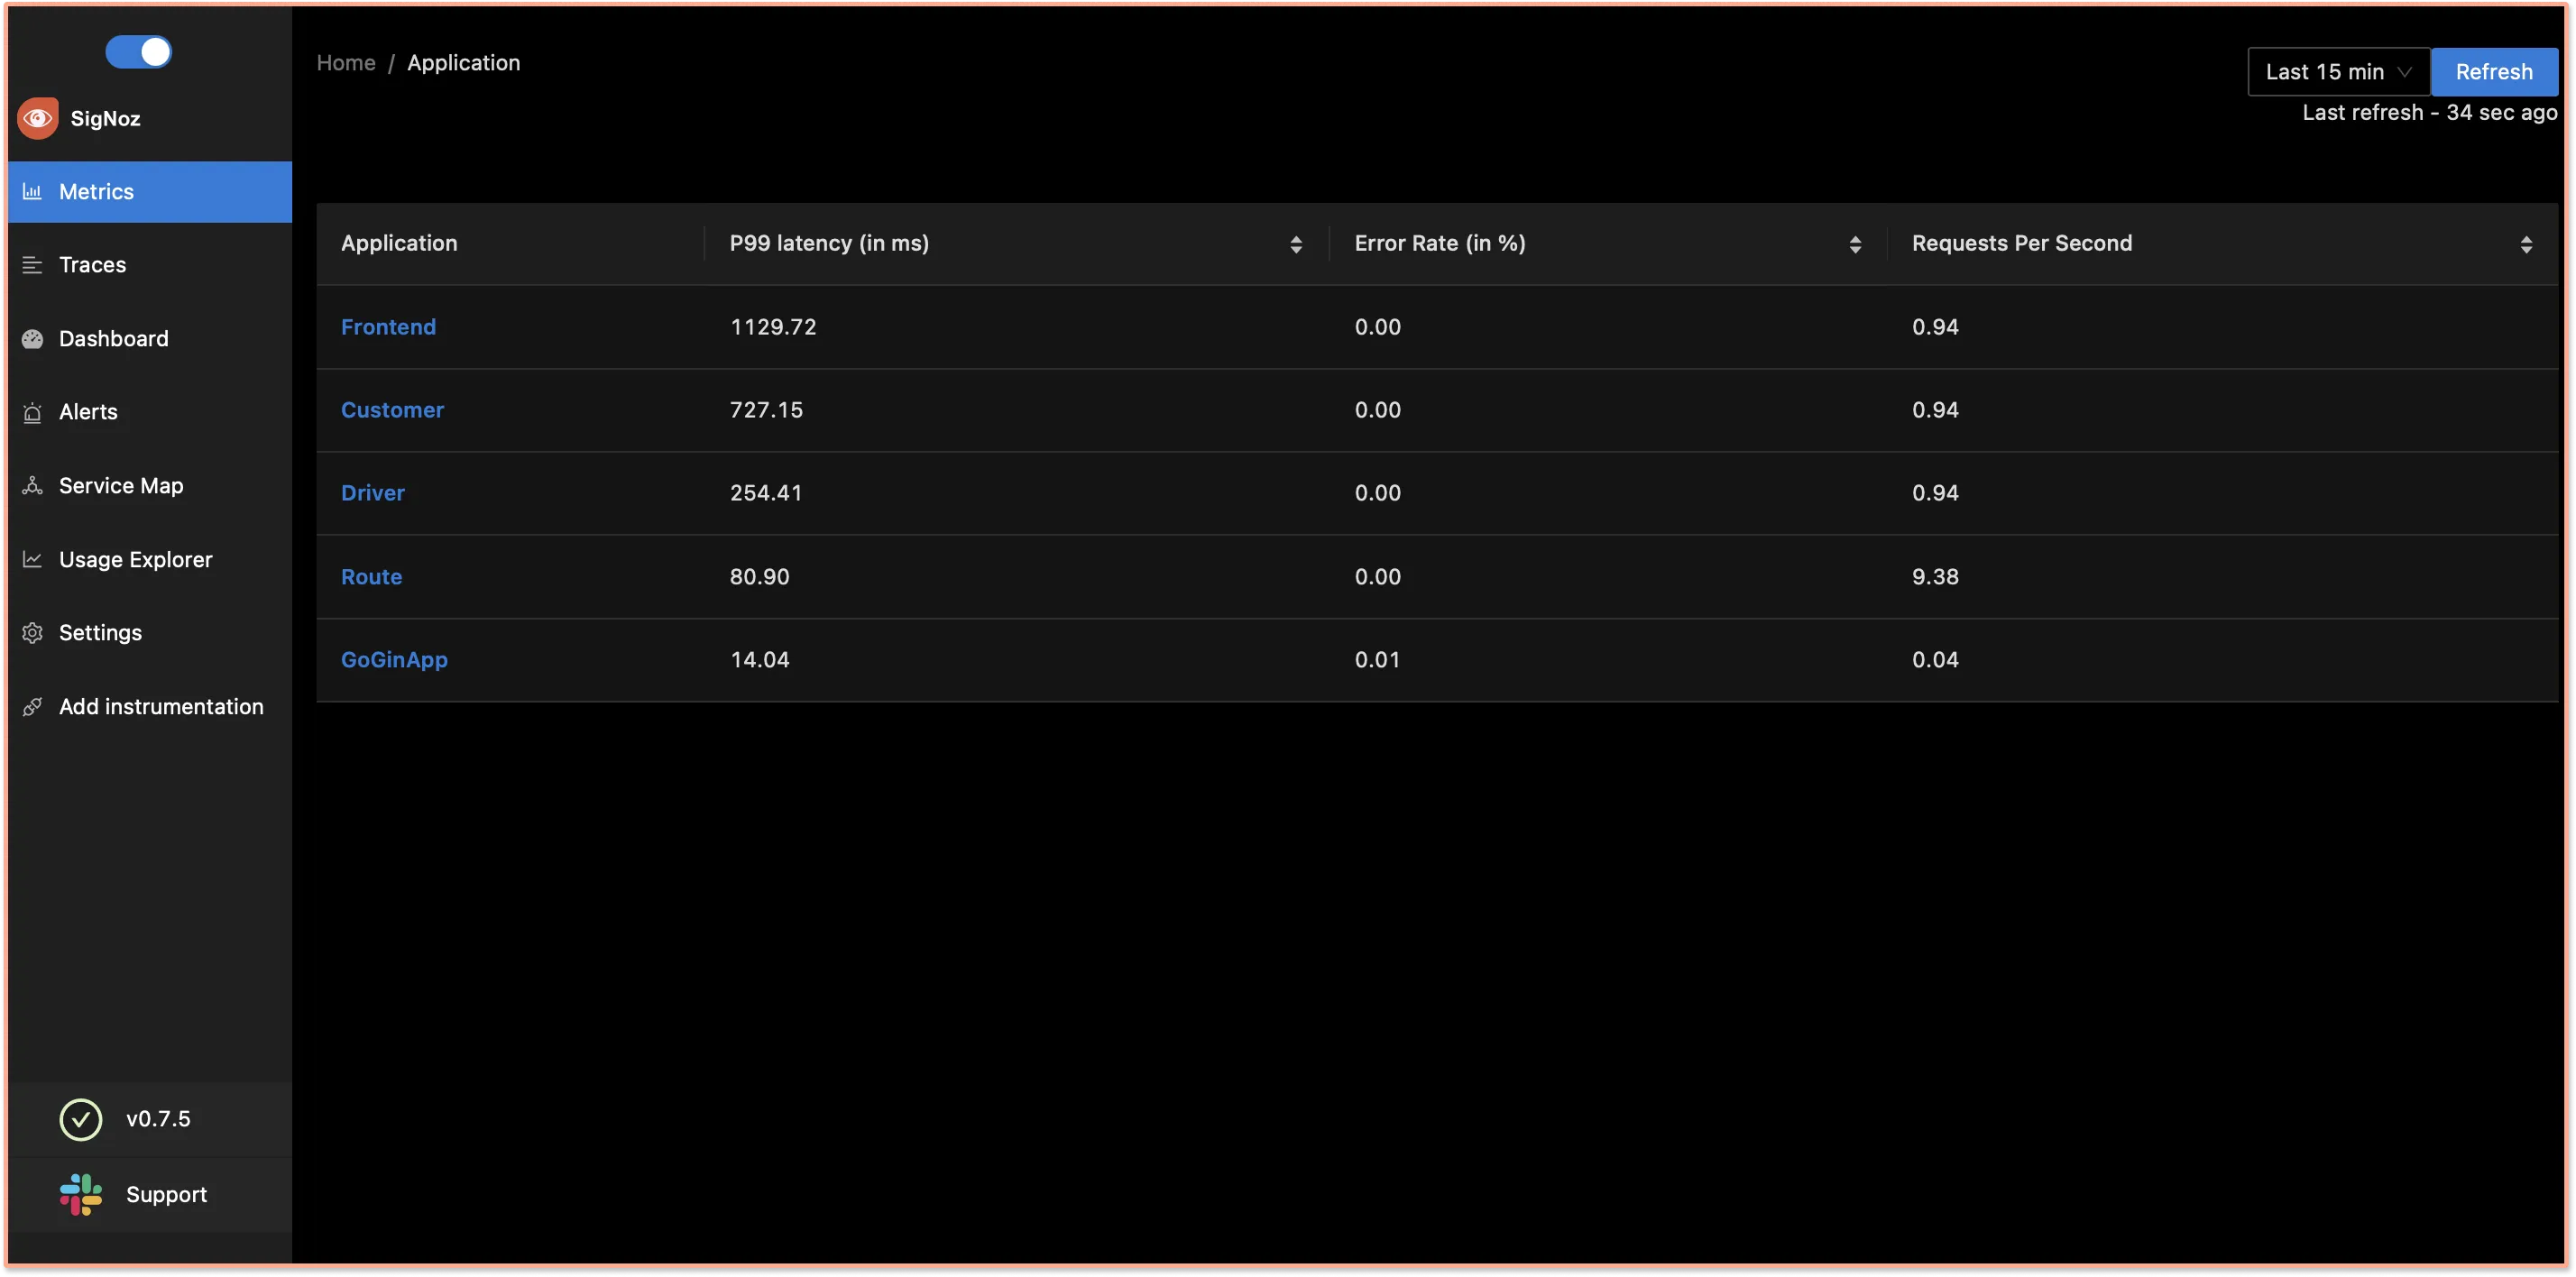
You can monitor application metrics like application latency, requests per second, error percentage, etc. with the Metrics tab of SigNoz.
OpenTelemetry captures tracing data from your Gin application as well. Tracing data can help you visualize how user requests perform across services in a multi-service application.
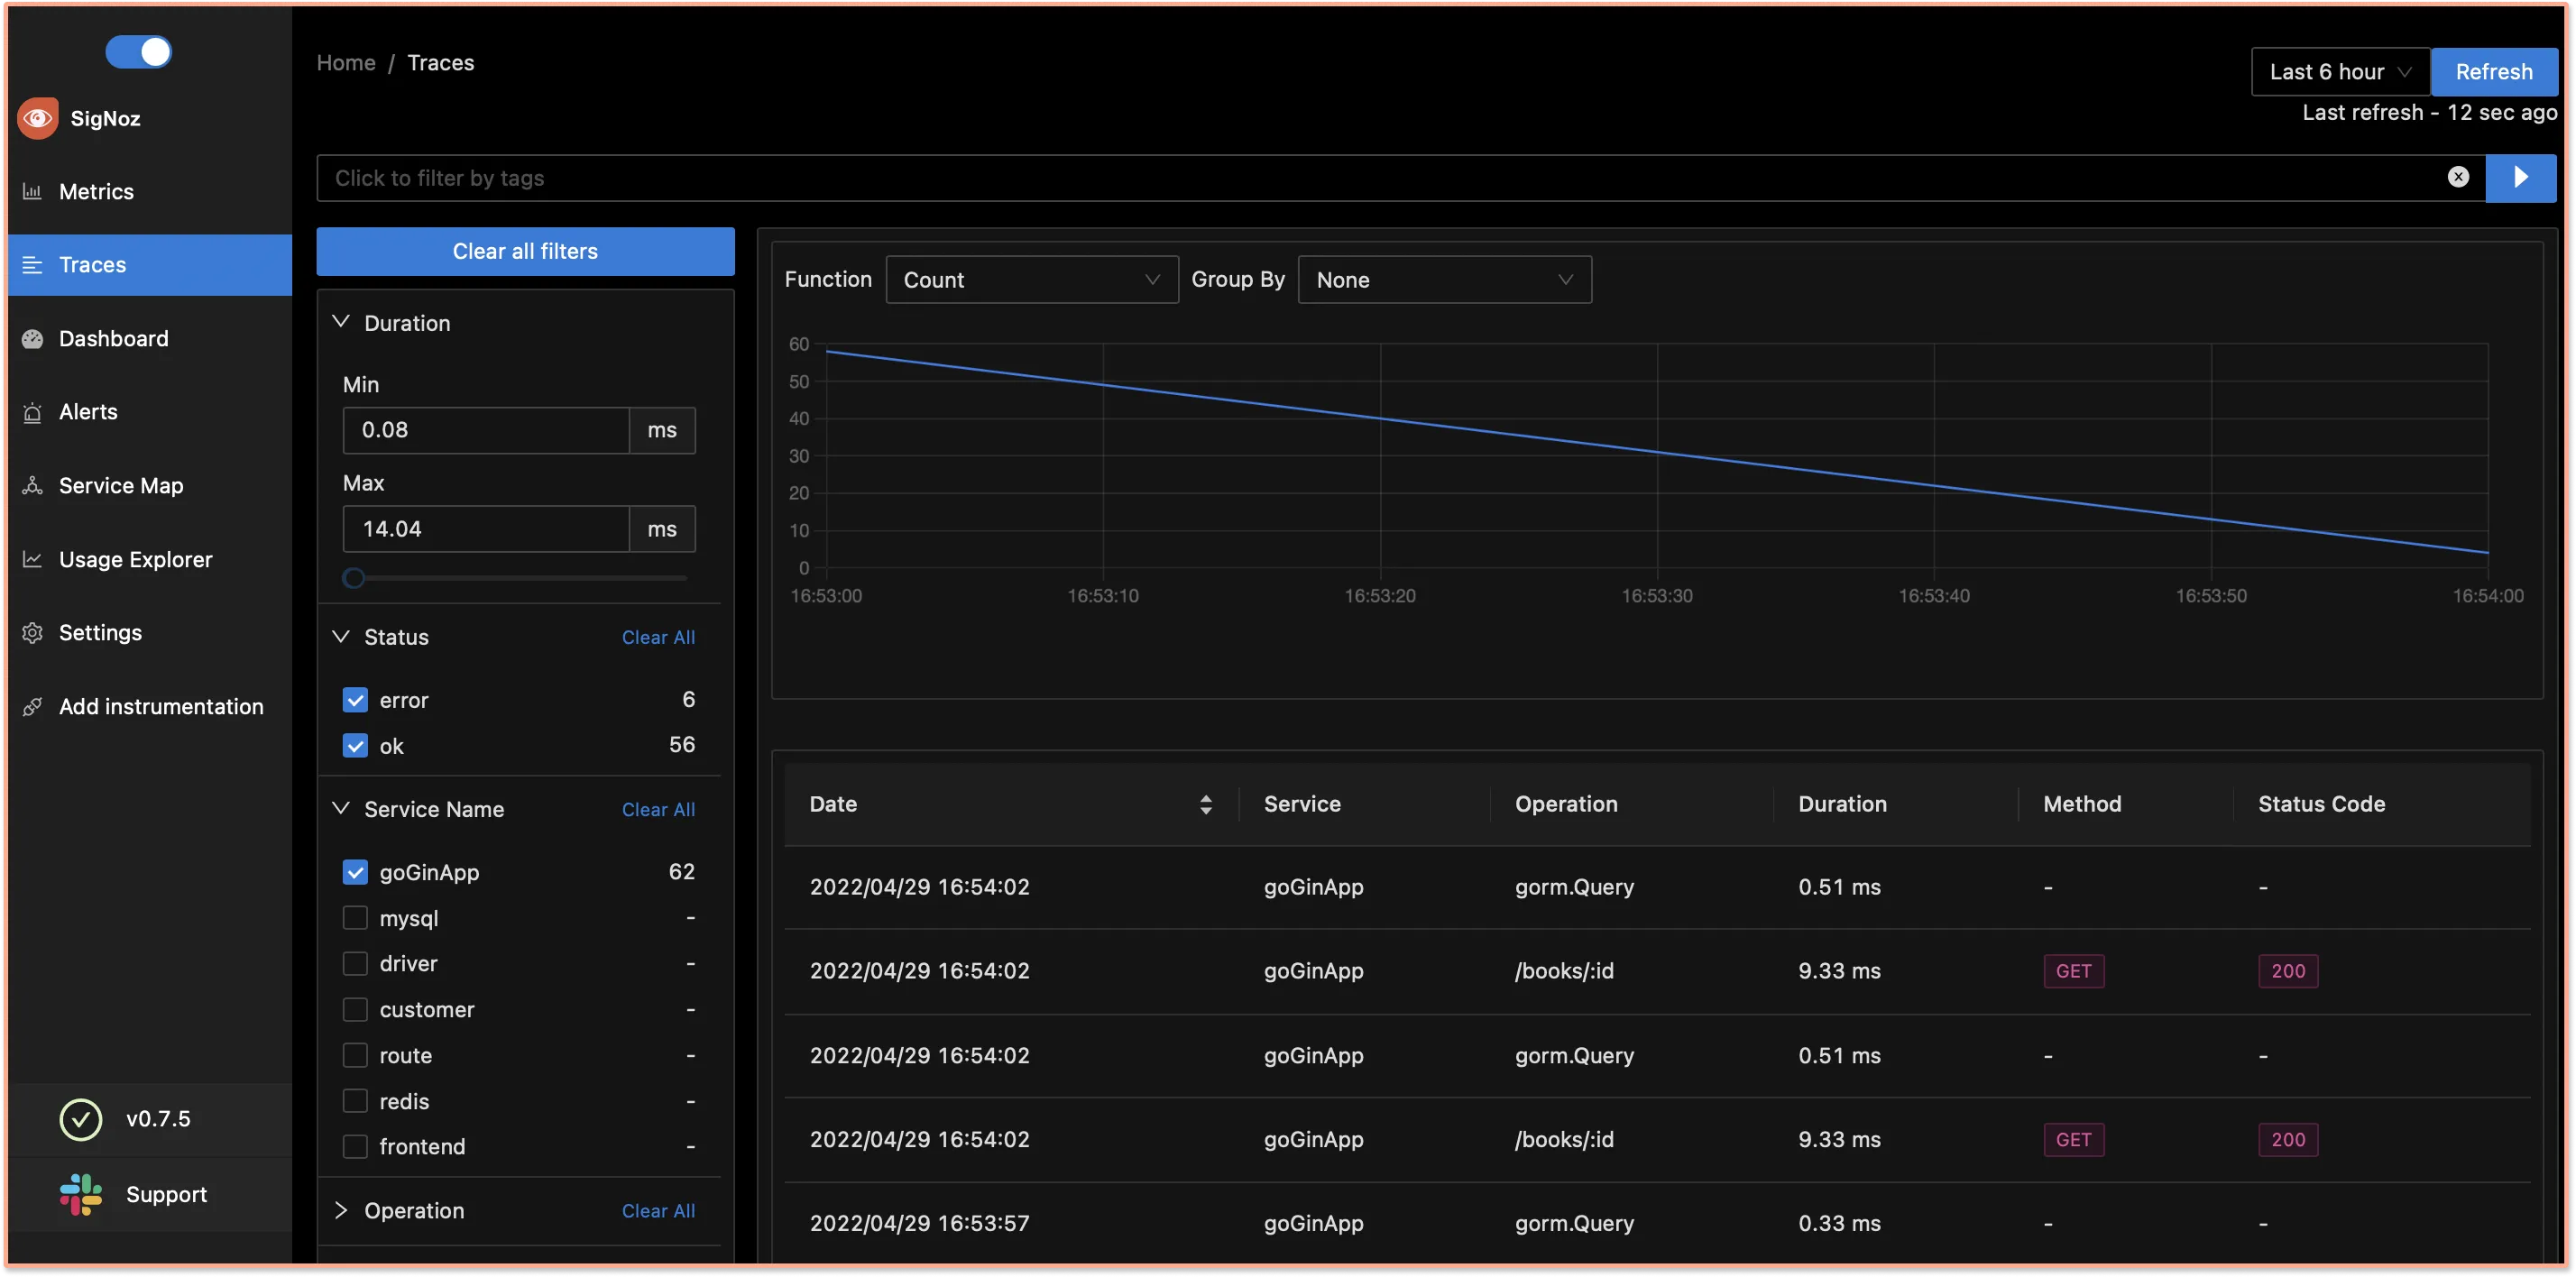
In the Traces tab of SigNoz, you can analyze the tracing data using filters based on tags, status codes, service names, operations, etc.
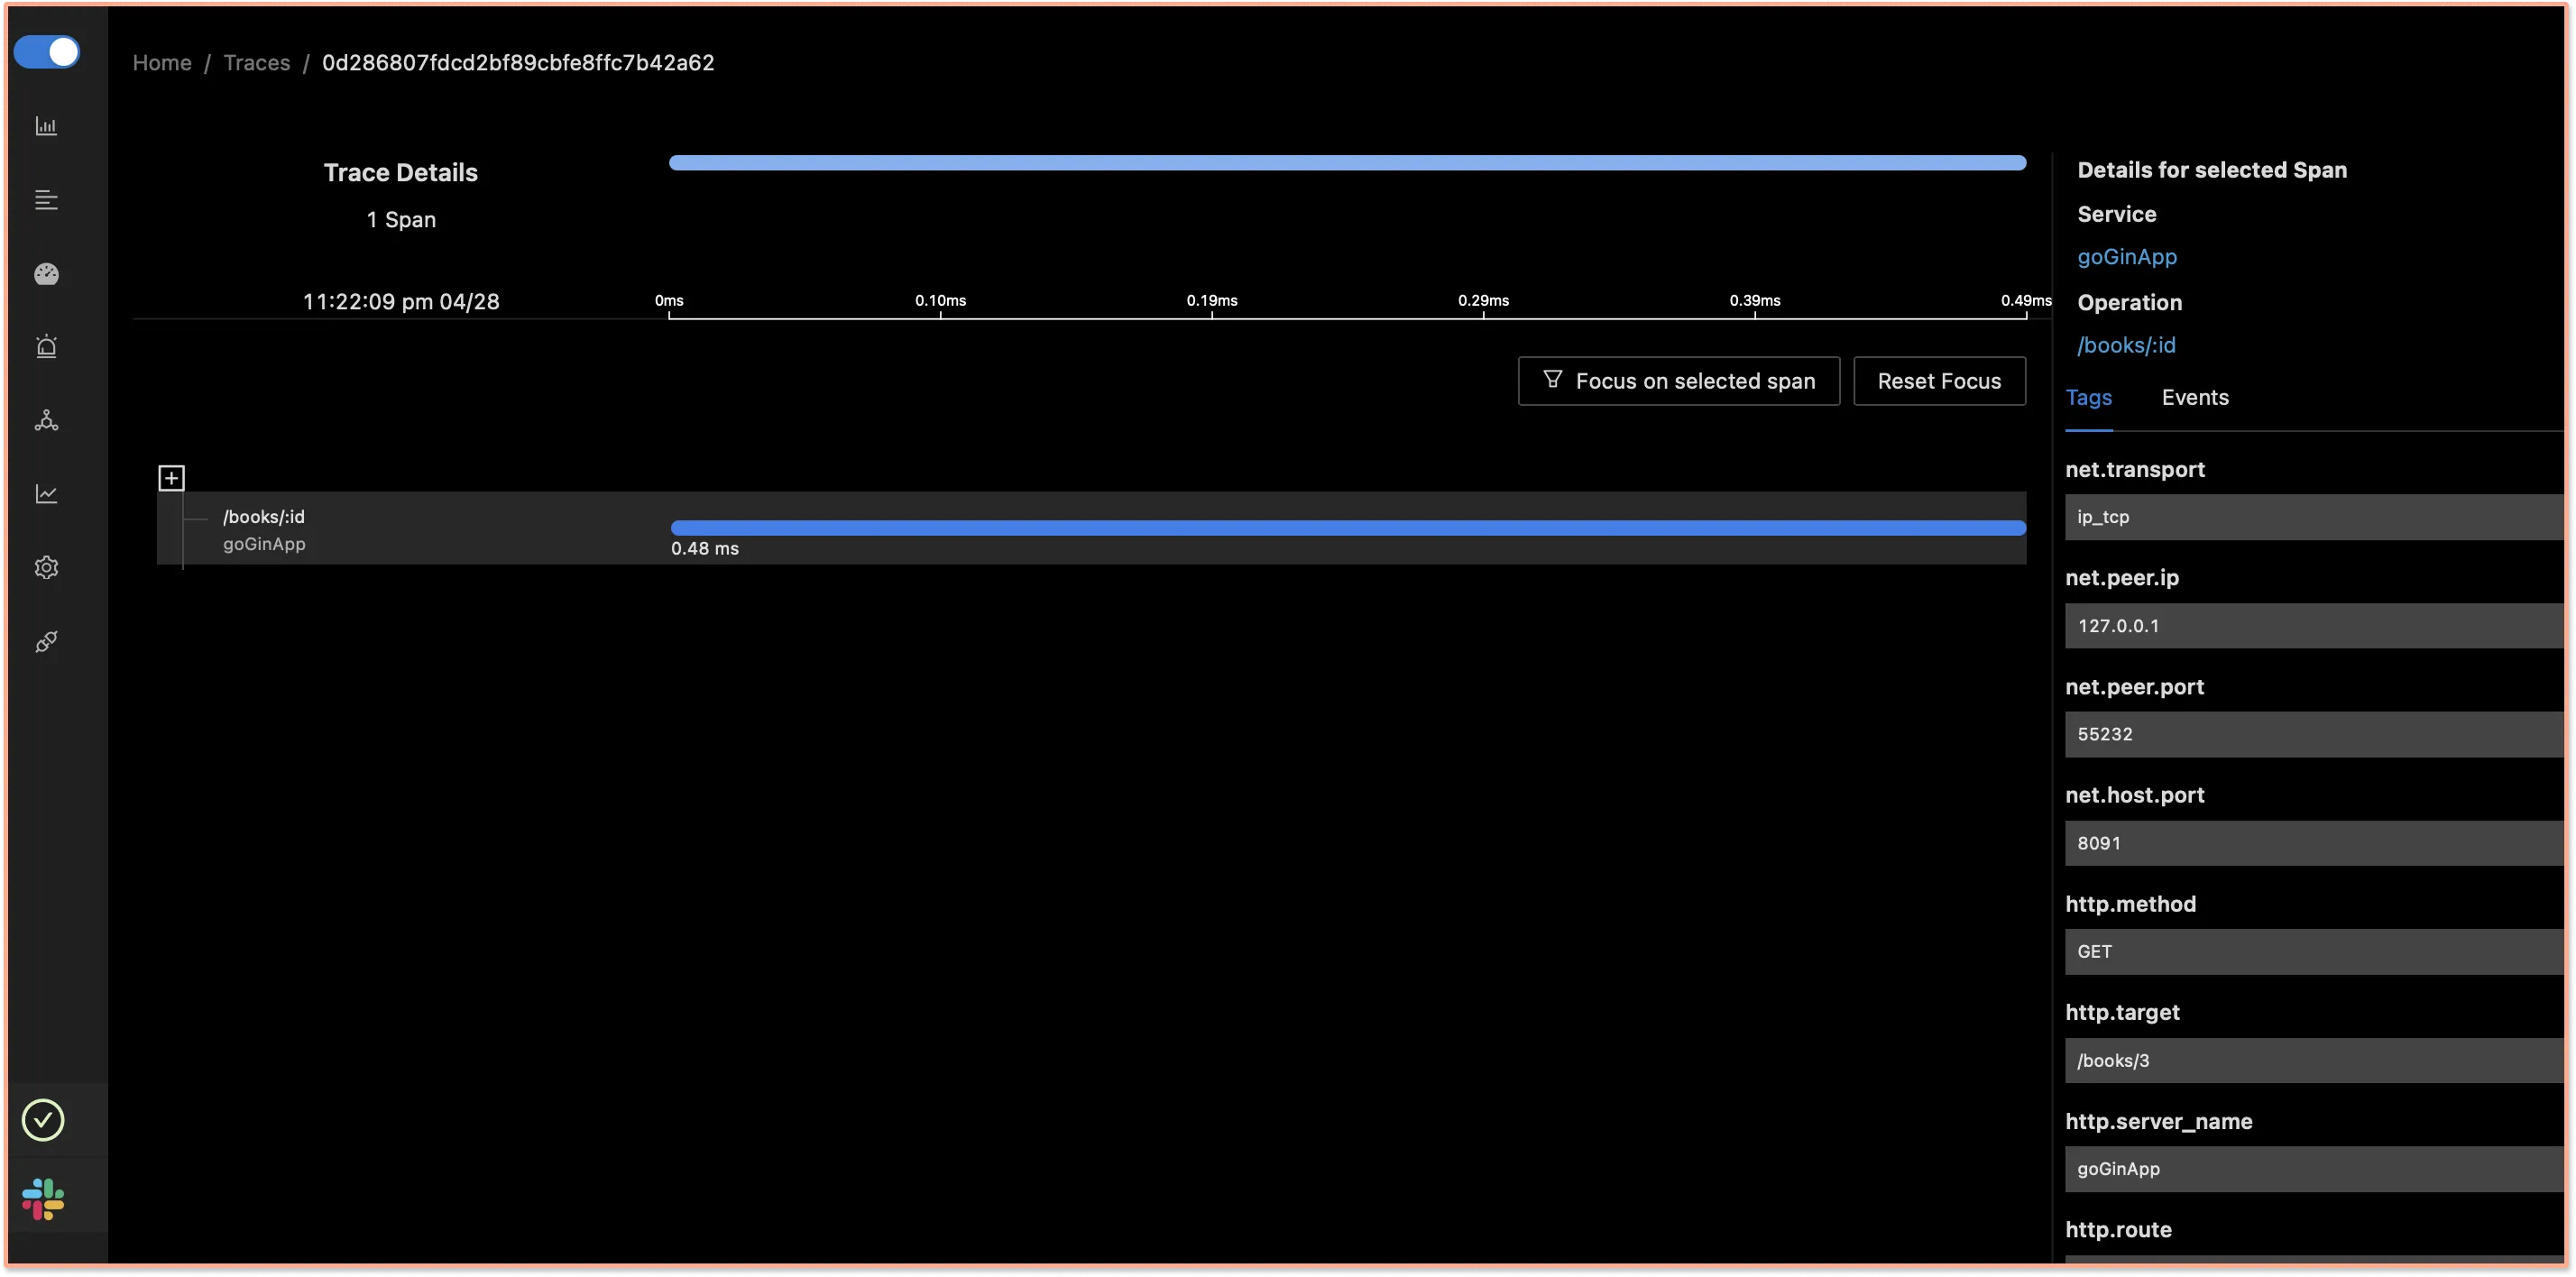
You can also visualize your tracing data with the help of flamegraphs and Gantt charts.
Conclusion
Using OpenTelemetry libraries, you can instrument your Go applications for setting up observability. You can then use an open-source APM tool like SigNoz to ensure the smooth performance of your Go applications.
OpenTelemetry is the future for setting up observability for cloud-native apps. It is backed by a huge community and covers a wide variety of technology and frameworks. Using OpenTelemetry, engineering teams can instrument polyglot and distributed applications with peace of mind.
SigNoz is an open-source observability tool that comes with a SaaS-like experience. You can try out SigNoz by visiting its GitHub repo 👇
If you are someone who understands more from video, then you can watch the our video tutorial on how to implement OpenTelemetry Golang libraries and monitor the application with SigNoz.
If you want to read more about SigNoz 👇
Monitor your Spring Boot application with OpenTelemetry and SigNoz
Further Reading
SigNoz - an open-source alternative to DataDog


